Market Basics: A Beginner’s Guide to Understanding Financial Markets
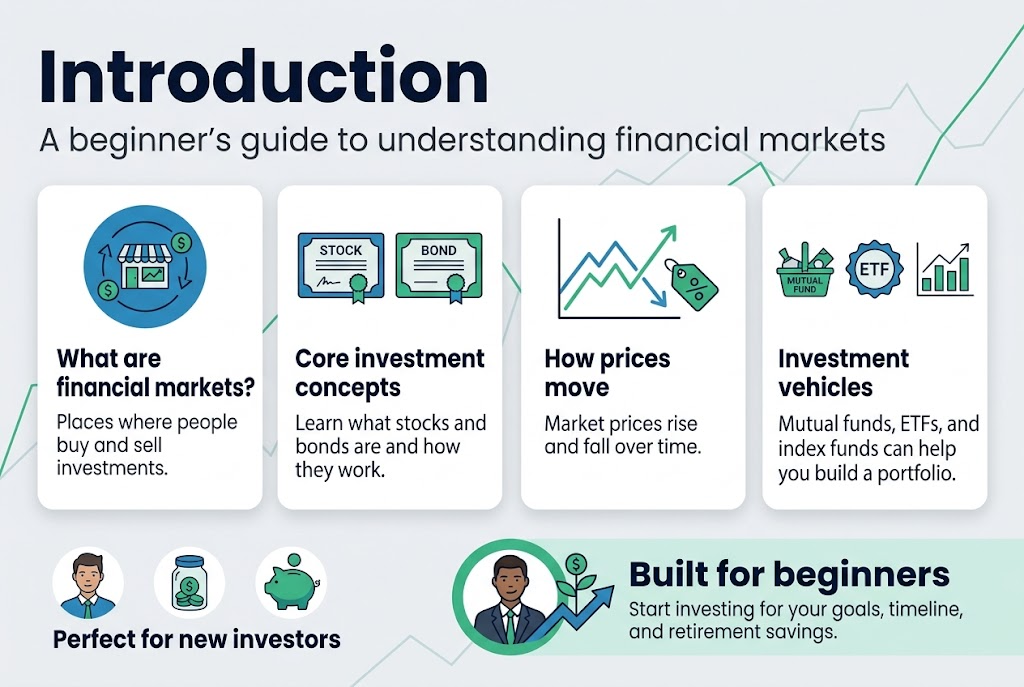
Financial markets might seem complicated, but they’re really just places where people buy and sell investments. This beginner’s guide to understanding financial markets breaks down everything new investors need to know about how these markets work and how to get started.
This guide is perfect for anyone who’s new to investing – whether you’re just starting your career, want to begin building wealth, or finally ready to tackle that retirement savings goal you’ve been putting off.
We’ll walk you through the core investment concepts every beginner should master, from understanding what stocks and bonds actually are to how market prices move up and down. You’ll also learn about different investment vehicles for building your portfolio, including mutual funds, ETFs, and index funds that can help you get started without needing to pick individual stocks right away.
By the end, you’ll have the confidence to take your first steps into investing and start building a strategy that makes sense for your goals and timeline.
Understanding What Financial Markets Are
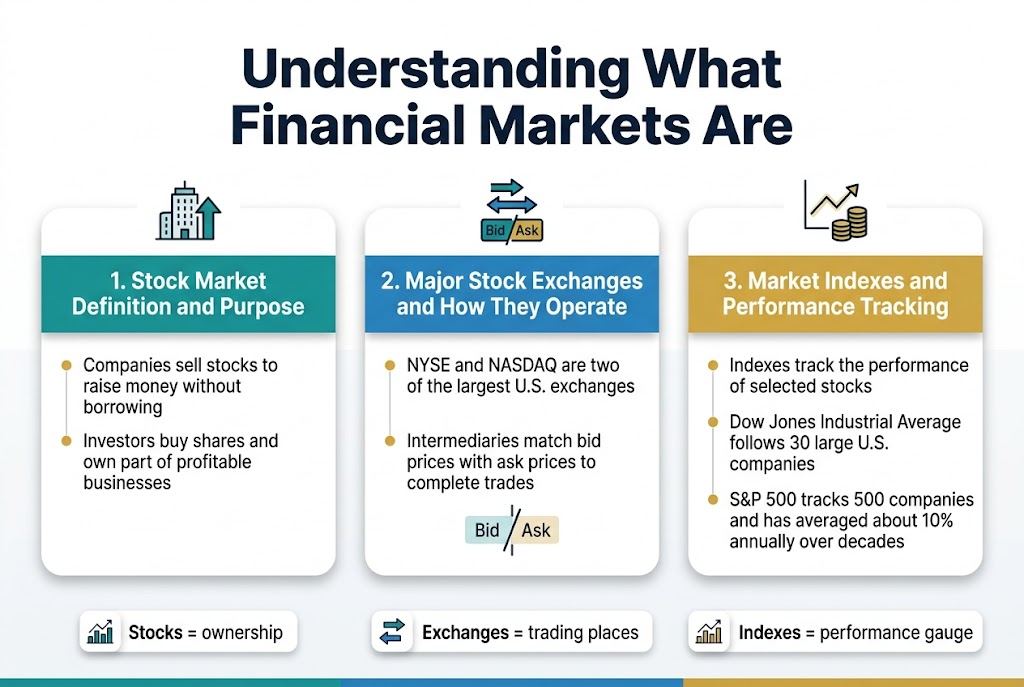
Stock Market Definition and Purpose
The stock market involves companies selling pieces of ownership, called stocks, to investors as a way to raise money without borrowing. This system allows businesses to access capital for growth while giving investors the opportunity to own shares in profitable enterprises.
Major Stock Exchanges and How They Operate
Company stocks are traded on exchanges, with the New York Stock Exchange (NYSE) and NASDAQ being two of the largest in the United States. Trading involves intermediaries who match ‘bid’ prices (what buyers are willing to pay) with ‘offer’ or ‘ask’ prices (what sellers want) to complete transactions.
Market Indexes and Performance Tracking
A market index tracks the performance of a select group of stocks, providing a gauge for how different market segments are performing. Major indexes include the Dow Jones Industrial Average, which follows 30 large U.S. companies, and the S&P 500, which tracks 500 companies and has historically shown an average annual return of about 10% over decades.
Core Investment Concepts Every Beginner Should Know
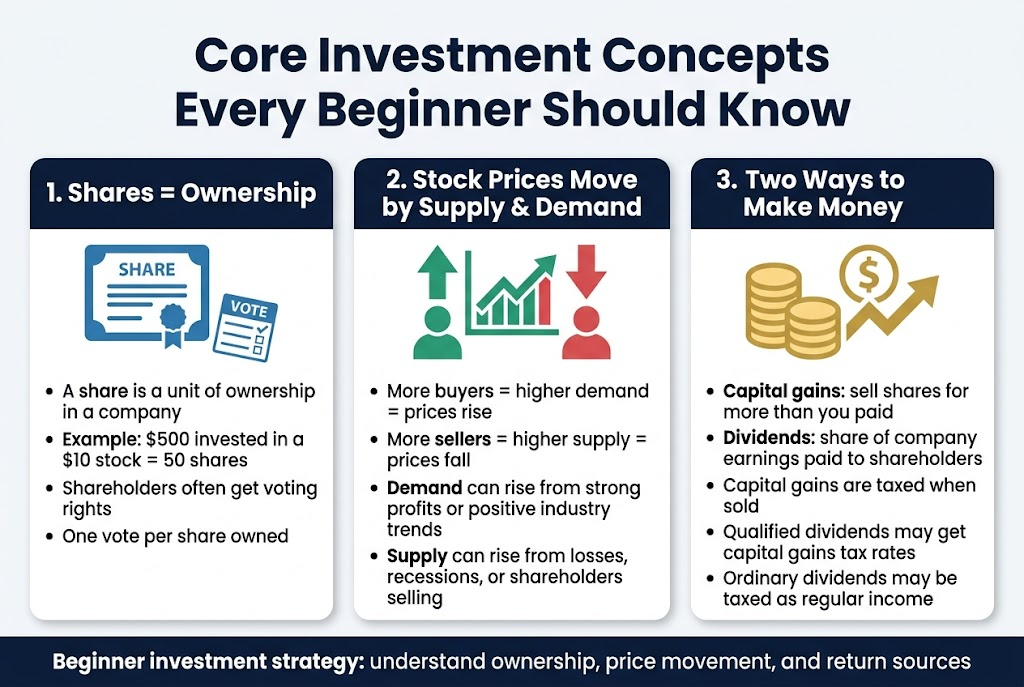
What Shares Represent and Ownership Rights
A share represents a unit of ownership in the company that issues it. For example, $500 invested in a $10 stock means owning 50 shares of that company. As a shareholder, you typically have voting rights on company issues, such as electing board directors, with one vote per share owned. This ownership structure forms the foundation of investment basics for beginners entering financial markets.
How Stock Prices Move Based on Supply and Demand
Stock prices are determined by supply and demand dynamics in financial markets for beginners to understand. High demand from many buyers bids up prices, while high supply from many sellers pushes prices down. Factors influencing demand include better-than-expected company profits or favorable industry trends. Conversely, factors influencing supply can be news of steep losses, economic recessions, or current stockholders cashing in on their earnings.
Two Ways to Make Money from Investments
Investors can make money through two primary methods when building their beginner investment strategy. Capital gains occur when selling shares for more than the purchase price, while dividends represent a portion of company earnings paid to shareholders. Capital gains are subject to capital gains tax, while dividends can be taxed at capital gains rates for qualified dividends or regular income tax rates for ordinary dividends.
Investment Vehicles for Building Your Portfolio
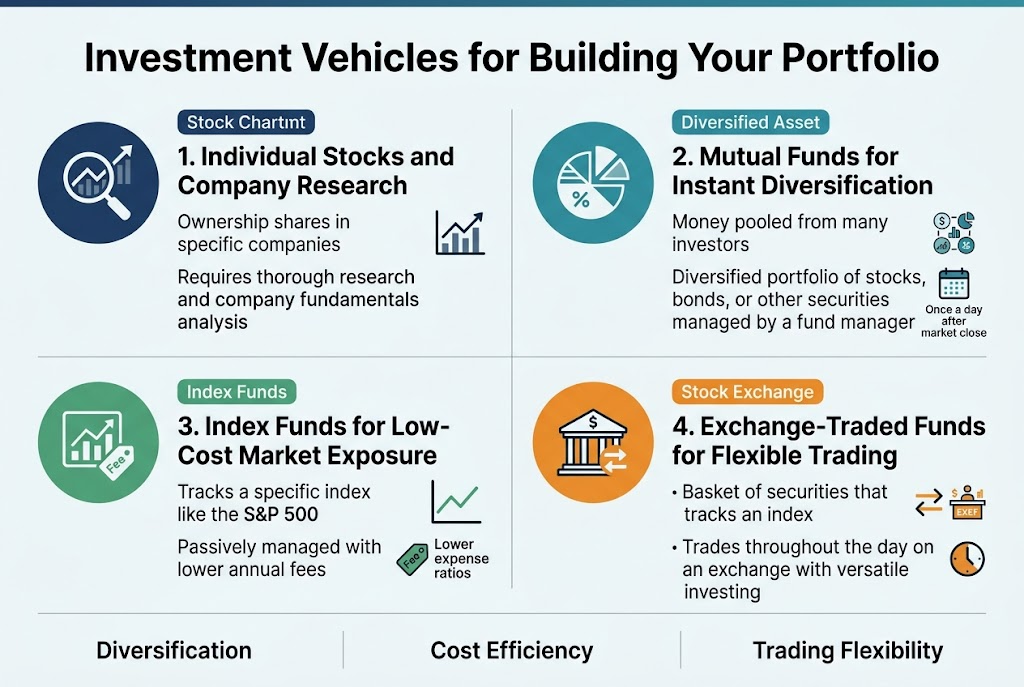
Individual Stocks and Company Research
Individual stocks represent ownership shares in specific companies, requiring thorough research before investment. When building your portfolio with individual stocks, understanding company fundamentals becomes crucial for making informed investment decisions.
Mutual Funds for Instant Diversification
Mutual funds pool money from many investors to buy a diversified portfolio of stocks, bonds, or other securities, managed by professional fund managers. A significant advantage of mutual funds is diversification, which can offset losses in some holdings with gains in others. These investment vehicles are bought or sold once daily after market close and don’t trade on exchanges.
Index Funds for Low-Cost Market Exposure
Index funds are a specialized type of mutual fund that mimics the performance of specific market indexes like the S&P 500 by purchasing similar securities. They operate as passively managed funds, meaning professional money managers don’t actively pick securities, which leads to notably lower annual fees and expense ratios for investors.
Exchange-Traded Funds for Flexible Trading
Exchange-Traded Funds (ETFs) combine features of index funds and individual stocks by investing in security baskets that track specific indexes while being listed on exchanges for all-day trading. ETFs often maintain lower annual fees than traditional mutual funds, though trading them throughout market hours might incur additional commission costs for investors.
Specialized Investment Options for Different Goals
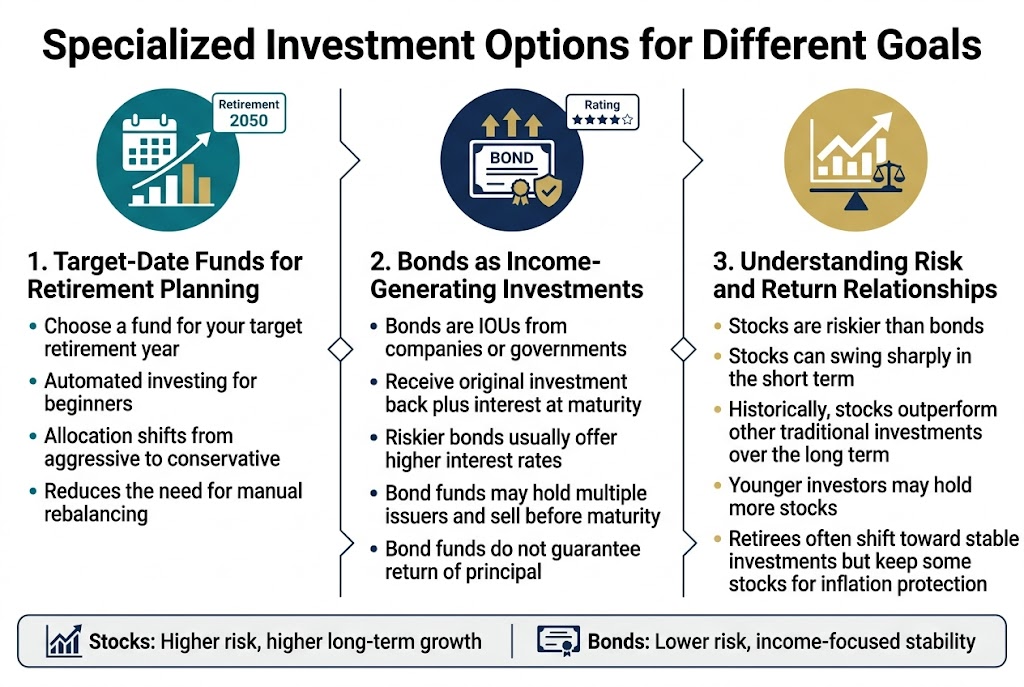
Target-Date Funds for Retirement Planning
Target-date funds, commonly found in workplace retirement plans, offer automated investing solutions for beginners seeking portfolio building strategies. These funds work by having investors choose a fund matching their target retirement year, such as Retirement 2050. Fund managers then automatically adjust the portfolio allocation from aggressive to conservative investments as the retirement date approaches, eliminating the need for manual rebalancing.
Bonds as Income-Generating Investments
Bonds function as IOUs where investors lend money to companies or governments, receiving their original investment back plus interest at maturity. Riskier bonds typically offer higher interest rates, with rating agencies assessing each issuer’s ability to repay debt. Bond funds differ significantly from individual bonds, as they may hold bonds from multiple issuers and sell them before maturity, without guaranteeing the return of your original investment.
Understanding Risk and Return Relationships
Stocks carry more risk than bonds and experience volatile short-term price swings, but historically outperform other traditional investments over the long term, making them suitable for younger investors building portfolios. As investors approach retirement, financial experts recommend shifting some money from stocks to more stable investments, though retirees may still maintain some stock holdings to counter inflation effects.
Getting Started with Your First Investments
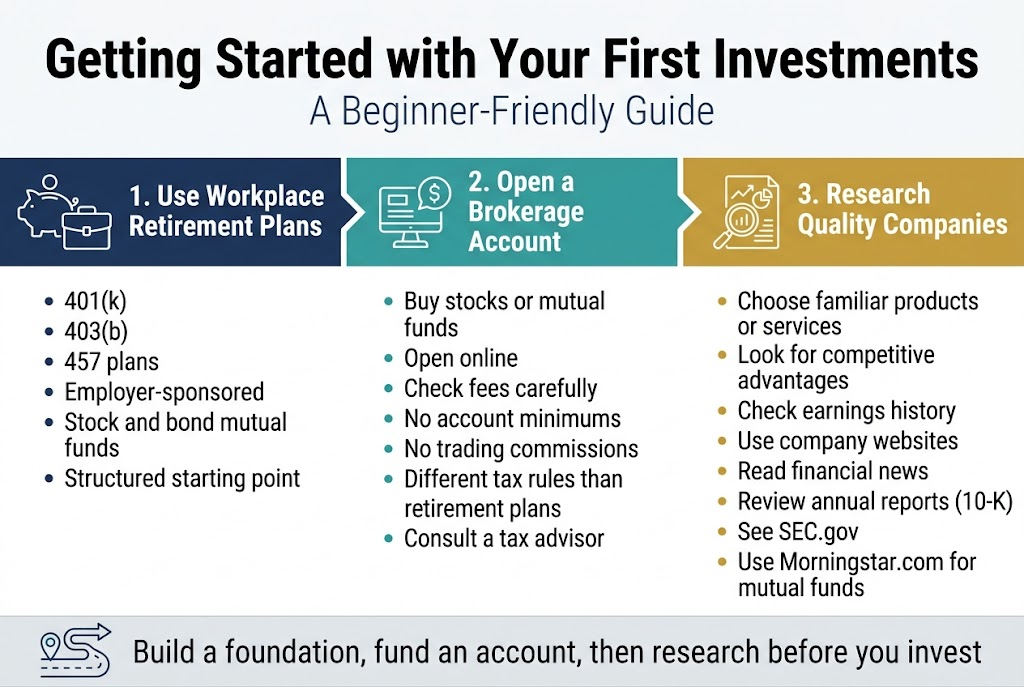
Using Workplace Retirement Plans as Your Foundation
The easiest way to begin your journey into financial markets for beginners is through workplace retirement plans like 401(k), 403(b), or 457 plans. These employer-sponsored accounts typically offer various stock and bond mutual funds, providing a structured foundation for beginner’s guide to investing without overwhelming choices.
Opening and Funding a Brokerage Account
To invest in individual stocks or mutual funds outside retirement plans, you’ll need to open and fund a brokerage account, which can often be done online. When selecting how to start investing through brokerages, check fees carefully as some online firms offer no account minimums or trading commissions. Remember that regular brokerage accounts have different tax implications compared to tax-deferred retirement plans, making consultation with a tax advisor recommended.
Research Methods for Finding Quality Companies
For investment basics research, start with publicly traded companies whose products or services you already know and like, focusing on those with competitive advantages and a history of increased earnings. Gather information from company websites, financial news, annual reports (10-K filings on SEC.gov), and analysts’ reports from brokerage firms. For mutual fund performance analysis, utilize resources like Morningstar.com to support your portfolio building strategies.
Building a Smart Investment Strategy
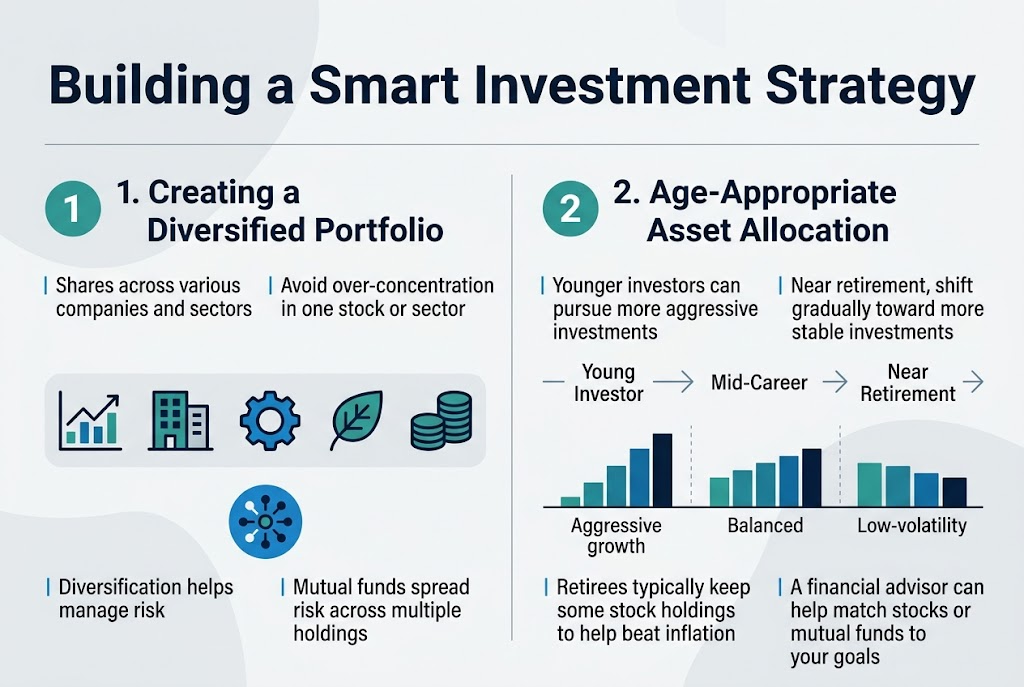
Creating a Diversified Portfolio
Now that we understand investment fundamentals, building a smart investment strategy begins with creating a well-diversified portfolio that includes shares across various companies and different sectors. Over-concentration in one stock or sector can expose your entire portfolio to significant losses if that specific investment tumbles, making diversification essential for risk management. Diversification represents a key advantage of mutual funds, which inherently spread risk across multiple holdings.
Age-Appropriate Asset Allocation
With portfolio diversification established, asset allocation should align with your age and retirement timeline. Younger investors can pursue more aggressive investment approaches, while those nearing retirement should gradually shift toward more stable investments. However, even retirees typically maintain some stock holdings to keep pace with inflation. Working with a financial advisor can prove invaluable in recommending suitable stocks or mutual funds for your specific portfolio needs and risk tolerance.
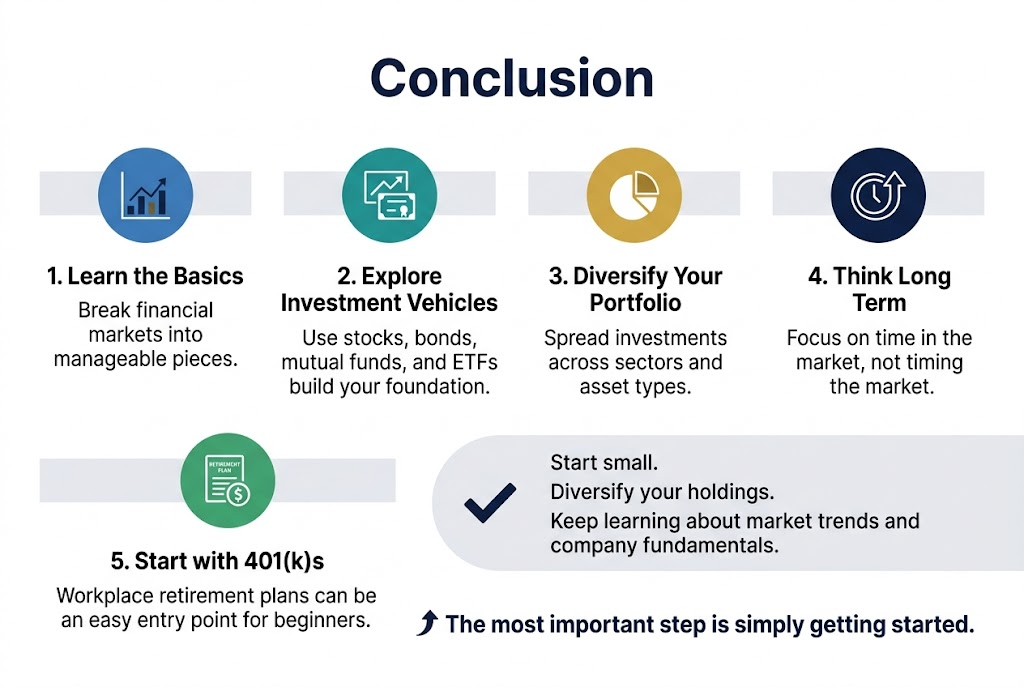
Understanding financial markets doesn’t have to be overwhelming when you break it down into manageable pieces. From grasping basic market concepts and exploring various investment vehicles to building a diversified portfolio with stocks, bonds, mutual funds, and ETFs, you now have the foundational knowledge to begin your investment journey. Remember that successful investing is about time in the market rather than timing the market, and starting with workplace retirement plans like 401(k)s often provides the easiest entry point for beginners.
The key to building wealth through financial markets lies in developing a smart, long-term strategy that aligns with your goals and risk tolerance. Start small, diversify your holdings across different sectors and asset types, and continuously educate yourself about market trends and company fundamentals. Whether you choose to invest in individual stocks, index funds, or target-date funds, the most important step is simply getting started. Your future financial security depends on the investment decisions you make today, so take that first step and begin building your path toward financial independence.