How to Master Smart Money Concepts in 30 Days (Beginner’s Path)
Smart money concepts might sound intimidating, but you can learn the basics in just 30 days with the right approach. This beginner trading guide breaks down complex institutional trading strategies into bite-sized daily lessons that anyone can follow.
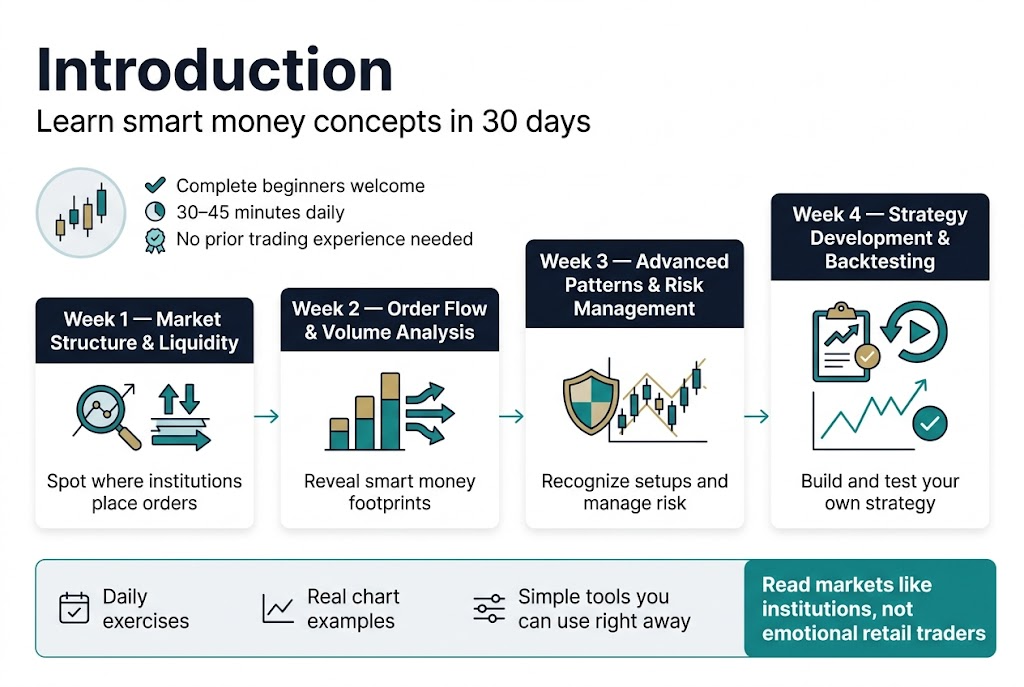
This 30 day trading challenge is designed for complete beginners who want to understand how big money moves markets. You don’t need any prior trading experience – just commitment to practice 30-45 minutes daily.
We’ll start with market structure analysis and liquidity trading fundamentals in week one, teaching you to spot where institutions place their orders. Week two focuses on order flow analysis and volume analysis trading techniques that reveal smart money footprints. By week three, you’ll recognize advanced smart money patterns and learn proper risk management. The final week brings everything together as you develop your own trading strategy development approach through practical backtesting.
Each week includes daily exercises, real chart examples, and simple tools you can use right away. You’ll learn to read markets like institutions do, not like retail traders who often get trapped by emotional decisions.
Understanding Smart Money Fundamentals
Define smart money and institutional trading behavior
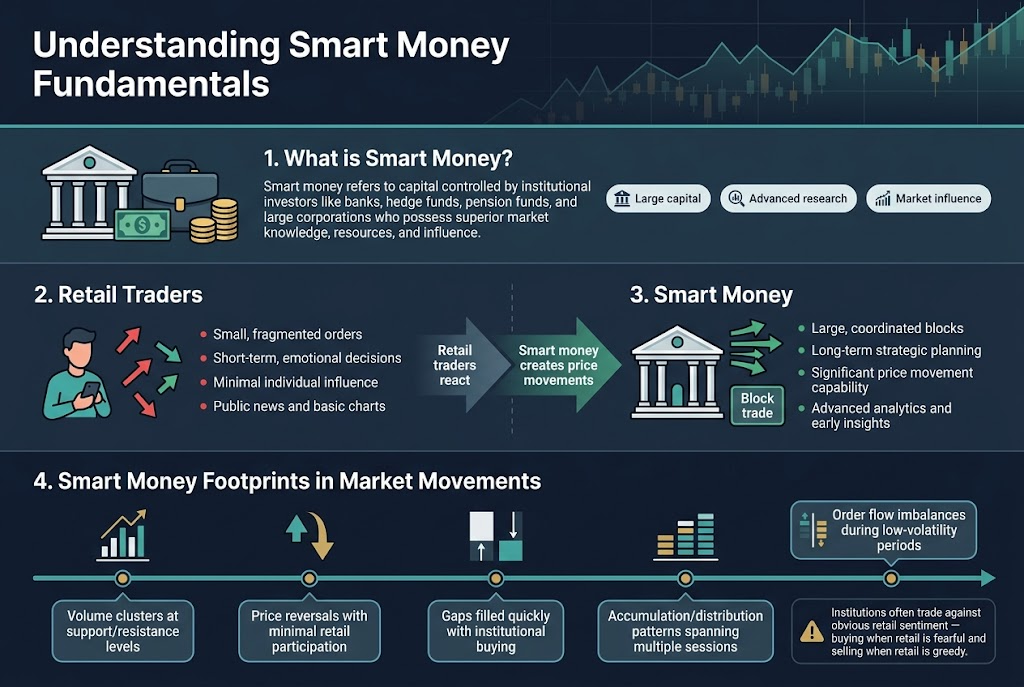
Smart money refers to capital controlled by institutional investors like banks, hedge funds, pension funds, and large corporations who possess superior market knowledge, resources, and influence. These players move billions of dollars and create significant price movements through their coordinated buying and selling activities. Their trades often precede major market shifts because they have access to advanced research, insider information within legal bounds, and sophisticated analytical tools that retail traders simply don’t possess.
Identify key differences between retail and smart money approaches
| Aspect | Retail Traders | Smart Money |
|---|---|---|
| Position Size | Small, fragmented orders | Large, coordinated blocks |
| Time Horizon | Short-term, emotional decisions | Long-term strategic planning |
| Market Impact | Minimal individual influence | Significant price movement capability |
| Information Access | Public news and basic charts | Advanced analytics and early insights |
| Entry/Exit Strategy | React to price movements | Create price movements |
Retail traders typically chase breakouts and follow trends after they’ve already formed, while institutions accumulate positions quietly during consolidation periods. Smart money operates with patience, building positions over weeks or months, whereas retail traders often enter and exit within hours or days based on emotions and technical signals that may already be outdated.
Recognize smart money footprints in market movements
Smart money leaves distinct traces through unusual volume spikes during seemingly quiet periods, often accompanied by price rejection at key levels. You’ll notice large block trades appearing on time and sales data, creating absorption patterns where price struggles to move despite heavy buying or selling pressure. These institutions often trade against obvious retail sentiment – buying when retail is fearful and selling when retail is greedy.
Key footprints include:
- Volume clusters at support/resistance levels
- Price reversals with minimal retail participation
- Gaps filled quickly with institutional buying
- Accumulation/distribution patterns spanning multiple sessions
- Order flow imbalances during low-volatility periods
Essential Tools and Resources for Smart Money Analysis
Select the right trading platform and charting software
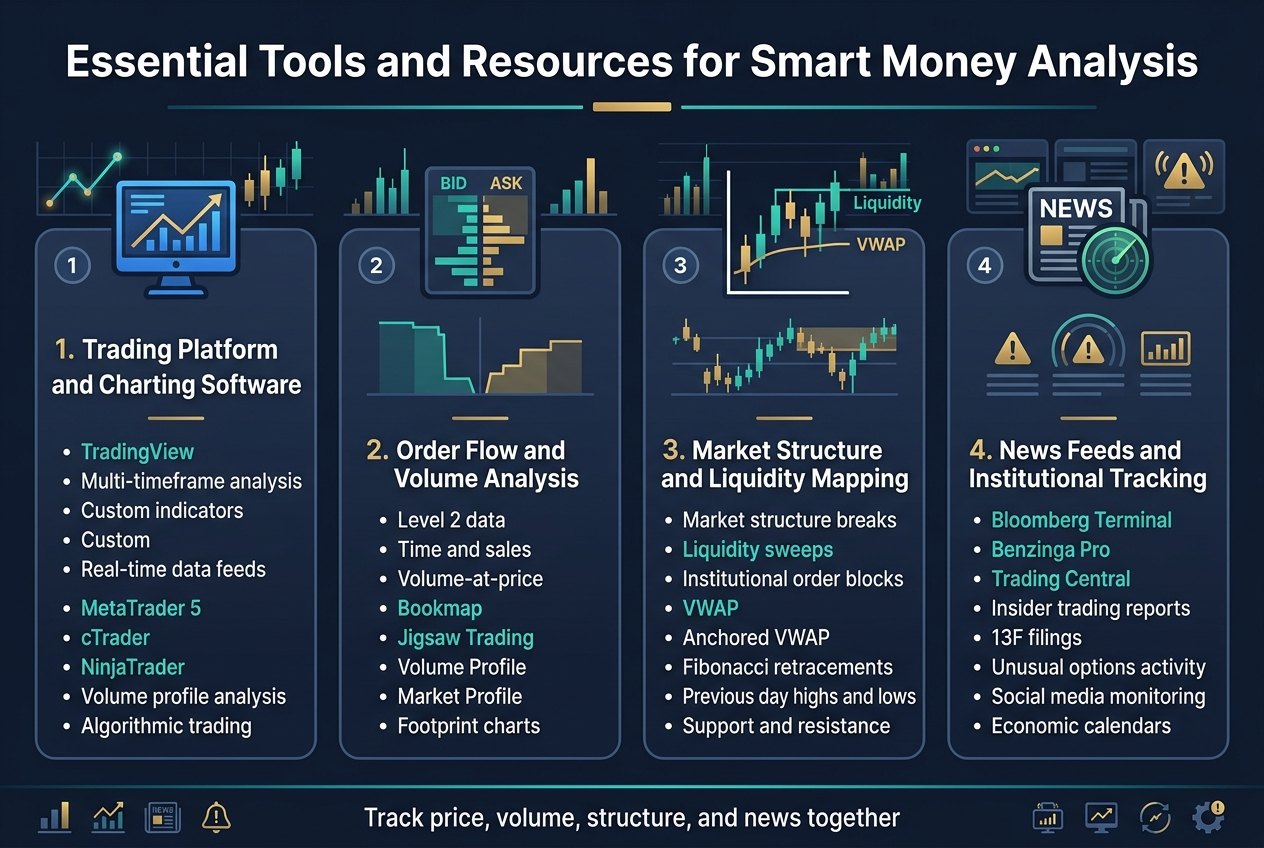
TradingView stands out as the gold standard for smart money analysis, offering advanced charting capabilities and institutional-grade tools. Look for platforms that provide multi-timeframe analysis, custom indicators, and real-time data feeds. MetaTrader 5 and cTrader also deliver professional features, while desktop solutions like NinjaTrader offer sophisticated order flow visualization. Your platform should handle complex volume profile analysis and support algorithmic trading if you plan to automate strategies.
Access institutional order flow data and volume analysis tools
Professional traders rely on Level 2 data, time and sales information, and volume-at-price indicators to track institutional movements. Bookmap and Jigsaw Trading provide exceptional order flow visualization, showing real-time bid-ask dynamics and large block trades. Volume Profile and Market Profile tools reveal where institutions accumulate positions, while footprint charts display the actual buying and selling pressure at each price level.
Use market structure indicators and liquidity mapping
Smart money leaves clear footprints through market structure breaks, liquidity sweeps, and institutional order blocks. Volume Weighted Average Price (VWAP) and anchored VWAP help identify fair value zones where institutions operate. Fibonacci retracements combined with previous day highs and lows create liquidity maps that show where stops cluster. Order block indicators highlight areas where banks and hedge funds placed significant orders, creating future support and resistance levels.
Set up news feeds for institutional activity tracking
Bloomberg Terminal access gives you the same information that moves institutional money, though expensive alternatives like Benzinga Pro and Trading Central offer similar insights. Track insider trading reports, 13F filings, and unusual options activity through SEC databases and specialized scanners. Social media monitoring tools can catch early sentiment shifts, while economic calendars help predict when central banks and major institutions will act on currency and bond markets.
Week 1: Market Structure and Liquidity Concepts
Master support and resistance from institutional perspective
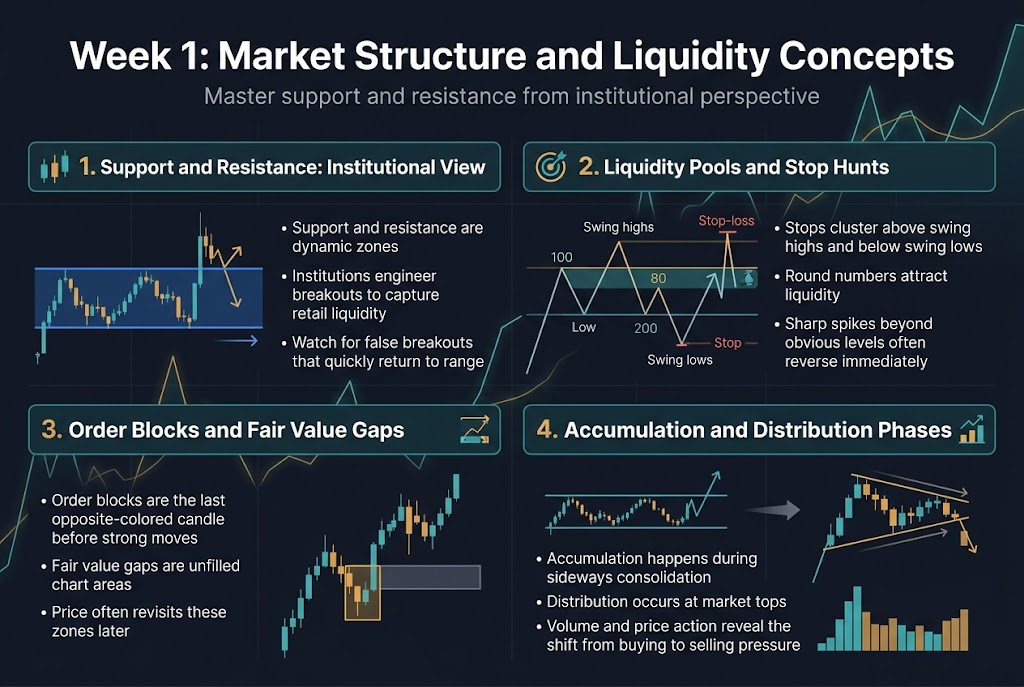
Traditional retail traders see support and resistance as simple horizontal lines, but institutions view these levels as dynamic zones where significant order flow occurs. Smart money doesn’t just bounce off these levels – they engineer breakouts to capture retail liquidity before reversing. Watch for false breakouts that quickly return to range, indicating institutional manipulation.
Identify liquidity pools and stop hunt patterns
Liquidity pools form where retail traders place predictable stop losses – above swing highs, below swing lows, and at round numbers. Institutions deliberately push price into these areas to trigger stops and fill their large orders at favorable prices. Look for sharp spikes beyond obvious levels followed by immediate reversals back into range.
Understand order blocks and fair value gaps
Order blocks represent areas where institutions placed significant orders, creating imbalances that price often revisits. These zones appear as the last opposite-colored candle before strong moves. Fair value gaps occur when price moves so aggressively that it leaves unfilled areas on the chart. Price frequently returns to fill these gaps as institutions complete their order flow.
Practice reading institutional accumulation and distribution phases
Smart money accumulation happens during sideways consolidation periods when retail traders get bored and exit positions. Distribution occurs at market tops when institutions sell to enthusiastic retail buyers. Recognize these phases by studying volume patterns, price action within ranges, and the gradual shift from buying pressure to selling pressure that precedes major moves.
Week 2: Order Flow and Volume Analysis

Interpret volume profile and market auction theory
Volume profile reveals where institutions accumulate or distribute positions by showing price levels with highest trading activity. Market auction theory explains how smart money drives price discovery through controlled buying and selling at key levels. High volume nodes indicate institutional interest, while low volume areas signal potential breakout zones where price moves quickly through minimal resistance.
Recognize smart money entry and exit signals
Smart money leaves distinct footprints through aggressive volume spikes at support and resistance levels. Watch for sudden volume increases without corresponding price movement – this often signals institutional accumulation. Exit signals appear as volume divergences where price makes new highs but volume decreases, indicating smart money distribution to retail traders.
Analyze institutional buying and selling pressure
Institutional pressure shows up in sustained volume patterns rather than random spikes. Buying pressure creates consistent volume at higher prices with minimal pullbacks, while selling pressure generates heavy volume during declines. Compare relative volume to average daily volume – readings above 200% typically indicate institutional activity rather than retail participation.
Track large block trades and dark pool activity
Block trades exceeding 10,000 shares often represent institutional positioning and can be tracked through Level II data and time-and-sales feeds. Dark pools hide institutional order flow but leave clues through unusual price action and volume patterns. Look for sudden price gaps with minimal visible volume on exchanges, as this indicates significant dark pool execution affecting market structure.
Week 3: Advanced Smart Money Patterns
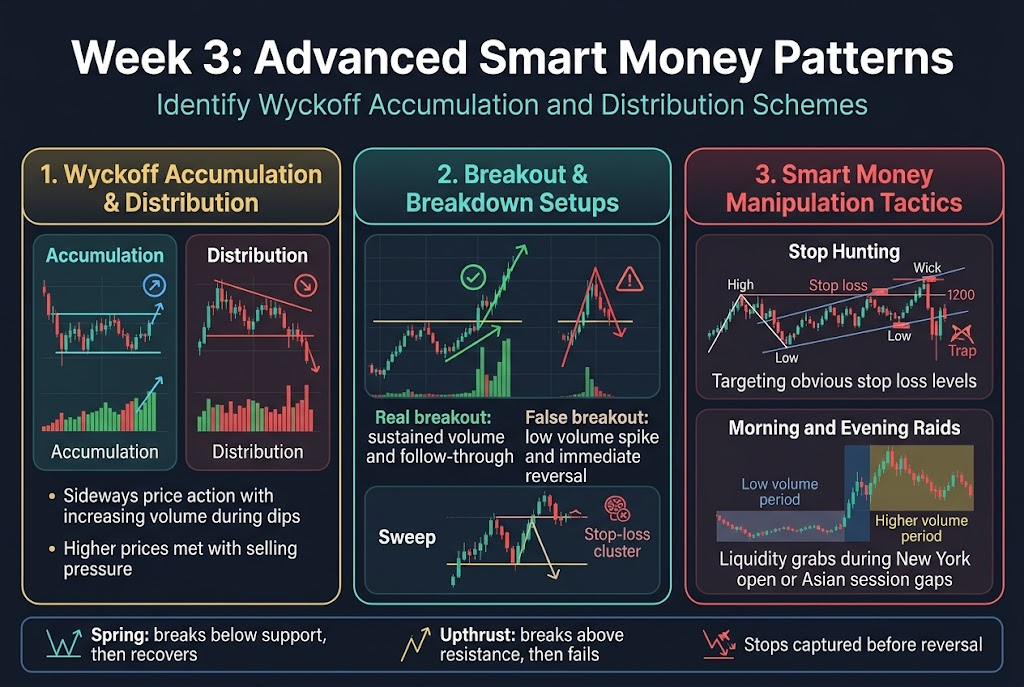
Identify Wyckoff Accumulation and Distribution Schemes
Wyckoff patterns reveal when institutions quietly gather positions before major moves. Accumulation phases show sideways price action with increasing volume during dips, signaling smart money buying weakness. Distribution patterns display the opposite – higher prices met with selling pressure as institutions offload positions to retail buyers.
Watch for spring and upthrust formations within these ranges. Springs occur when price briefly breaks below support then quickly recovers, trapping short sellers. Upthrusts break resistance momentarily before failing, catching breakout traders. These fake-outs create liquidity for institutional players.
Spot Institutional Breakout and Breakdown Setups
Real institutional breakouts differ from retail traps through volume confirmation and follow-through. Smart money breakouts show sustained volume after the initial move, often preceded by accumulation near resistance levels. False breakouts typically spike on low volume then immediately reverse.
Look for sweep patterns where price briefly exceeds key levels to grab stop losses before reversing direction. Institutions use these liquidity grabs to enter positions at better prices while retail traders get stopped out at the worst possible moments.
Recognize Smart Money Manipulation Tactics
Stop hunting represents the most common manipulation tactic where institutions push price to obvious stop loss levels. They target round numbers, previous highs and lows, and trend lines where retail traders place protective stops. This creates temporary spikes that quickly reverse once liquidity is captured.
Morning and evening raids happen during low-volume periods when institutions can move markets more easily. They push price against obvious levels during New York open or Asian session gaps, triggering retail orders before reversing direction during higher-volume periods when their real intentions become clear.
Week 4: Building Your Smart Money Trading Strategy
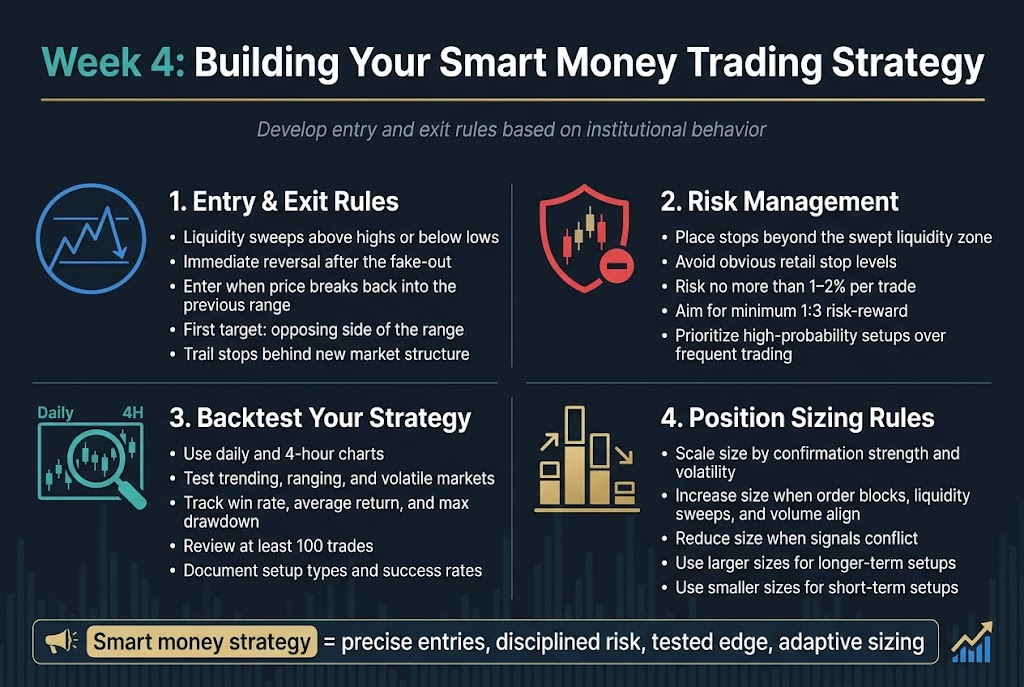
Develop entry and exit rules based on institutional behavior
Smart money leaves distinct footprints in price action that you can transform into precise entry rules. Watch for liquidity sweeps above recent highs or below recent lows, followed by immediate reversals – this signals institutions collecting orders before moving price in their intended direction. Your entry comes after the fake-out when price breaks back into the previous range with strong momentum.
Exit rules should mirror institutional profit-taking behavior. Target previous swing levels where retail traders typically place stops, as institutions often close positions at these liquidity pools. Set your first target at the opposing side of the range, then trail stops behind newly formed market structure to capture extended moves when institutions continue accumulating.
Create risk management protocols for smart money setups
Position your stops beyond the liquidity zone that institutions just swept, not at obvious technical levels where retail stops cluster. This protects you from secondary sweeps that smart money often executes to shake out weak hands. Risk no more than 1-2% per trade, as smart money setups can take time to develop and require patience.
Your risk-reward should align with institutional timeframes and objectives. Target minimum 1:3 ratios, but focus more on high-probability setups than perfect ratios. Smart money moves can deliver exceptional returns when you position correctly, so prioritize setup quality over frequent trading.
Backtest your strategy using historical institutional data
Use multiple timeframes to validate your smart money strategy, focusing on daily and 4-hour charts where institutional footprints are most visible. Test during different market conditions – trending, ranging, and volatile periods – to understand when your approach works best. Track win rates, average returns, and maximum drawdowns across at least 100 trades.
Document every setup type and their success rates. Liquidity sweeps in trending markets often perform differently than those in consolidation phases. Your backtest should reveal which smart money patterns work consistently and which market environments favor your strategy.
Establish position sizing rules aligned with smart money principles
Scale your position sizes based on setup confirmation strength and market volatility. When multiple smart money signals align – order blocks, liquidity sweeps, and institutional volume – increase your position size within your risk parameters. During uncertain market conditions or when signals conflict, reduce position sizes accordingly.
Consider the institutional timeframe you’re trading. Longer-term smart money setups warrant larger positions due to higher probability and extended profit potential. Shorter-term plays should use smaller sizes as they carry more noise and false signals from competing institutional flows.
Daily Practice Routines for Skill Development
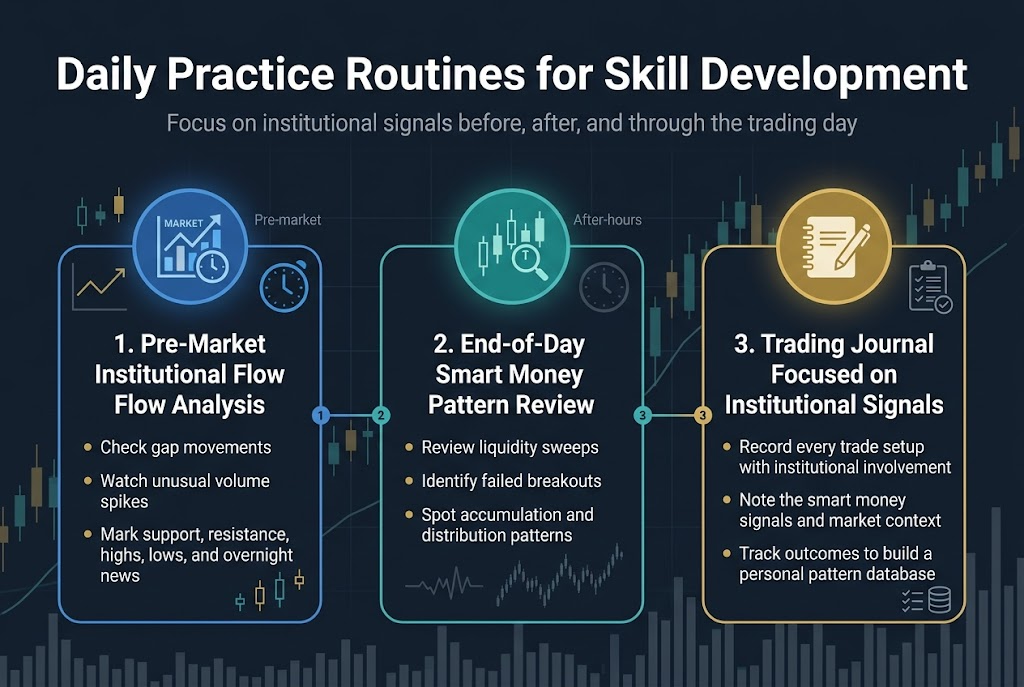
Conduct Pre-Market Institutional Flow Analysis
Start each trading day by analyzing institutional activity during pre-market hours. Check for significant gap movements, unusual volume spikes, and price action around key levels where smart money typically operates. Focus on major support and resistance zones, previous day’s highs and lows, and overnight news that might trigger institutional repositioning.
Perform End-of-Day Smart Money Pattern Review
After market close, review the day’s price action to identify institutional footprints. Look for liquidity sweeps, failed breakouts, and accumulation or distribution patterns that reveal where smart money entered or exited positions.
Maintain a Trading Journal Focused on Institutional Signals
Document every trade setup that shows institutional involvement, whether you took the trade or not. Record the specific smart money signals you observed, the market context, and the outcome. This creates a personal database of institutional patterns that will sharpen your pattern recognition skills over time.
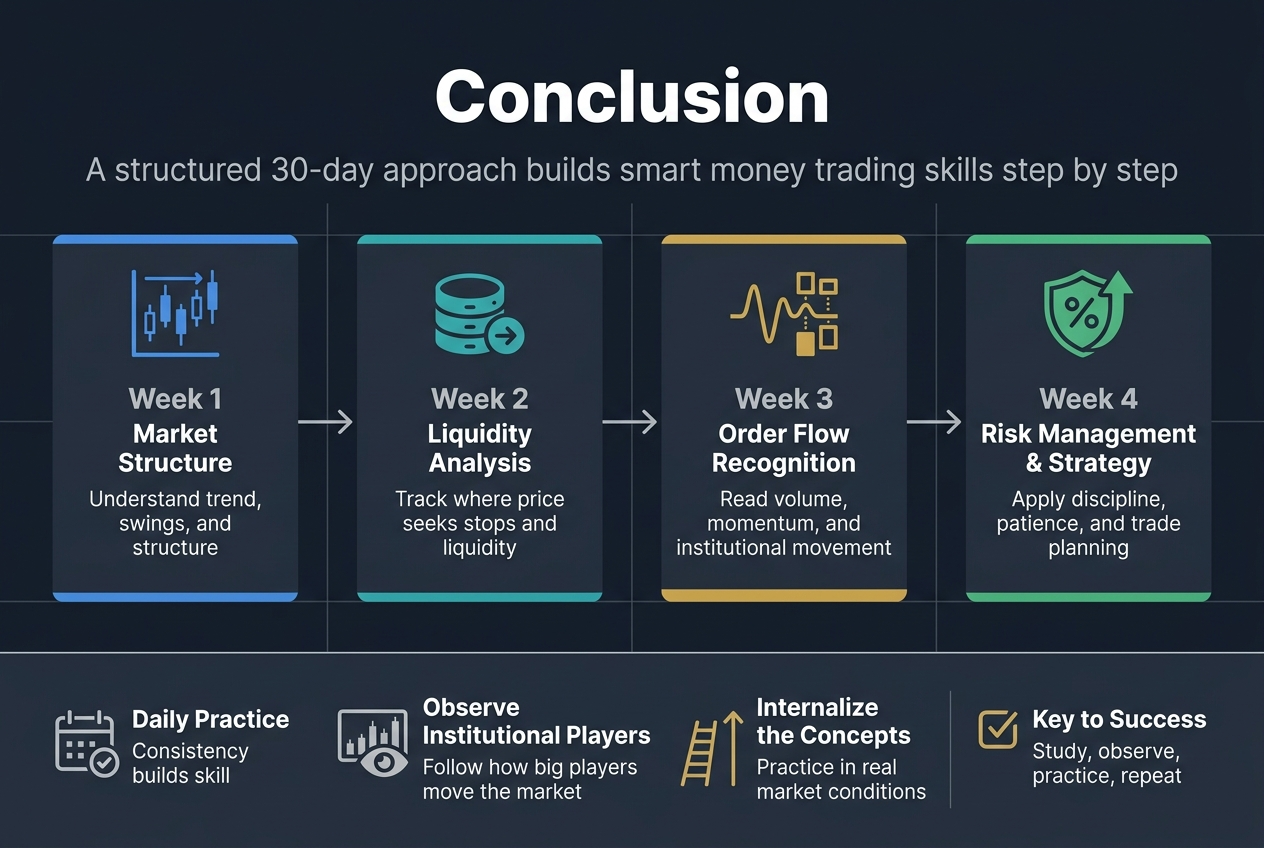
Learning smart money concepts doesn’t have to take years of trial and error. With the structured 30-day approach outlined above, you can build a solid foundation in market structure, liquidity analysis, and order flow recognition while developing the risk management skills that separate successful traders from the rest. Each week builds on the previous one, giving you time to practice and internalize these powerful concepts before moving forward.
The key to success lies in consistent daily practice and patient observation of how institutional players move the market. Start with understanding market structure in week one, then gradually add layers of complexity as you progress through volume analysis, advanced patterns, and strategy development. Remember that smart money concepts are tools to help you see the market through the eyes of the big players – but they only work if you put in the time to truly understand them and practice applying them in real market conditions.