7 Risk Management Rules That Saved My Trading Career
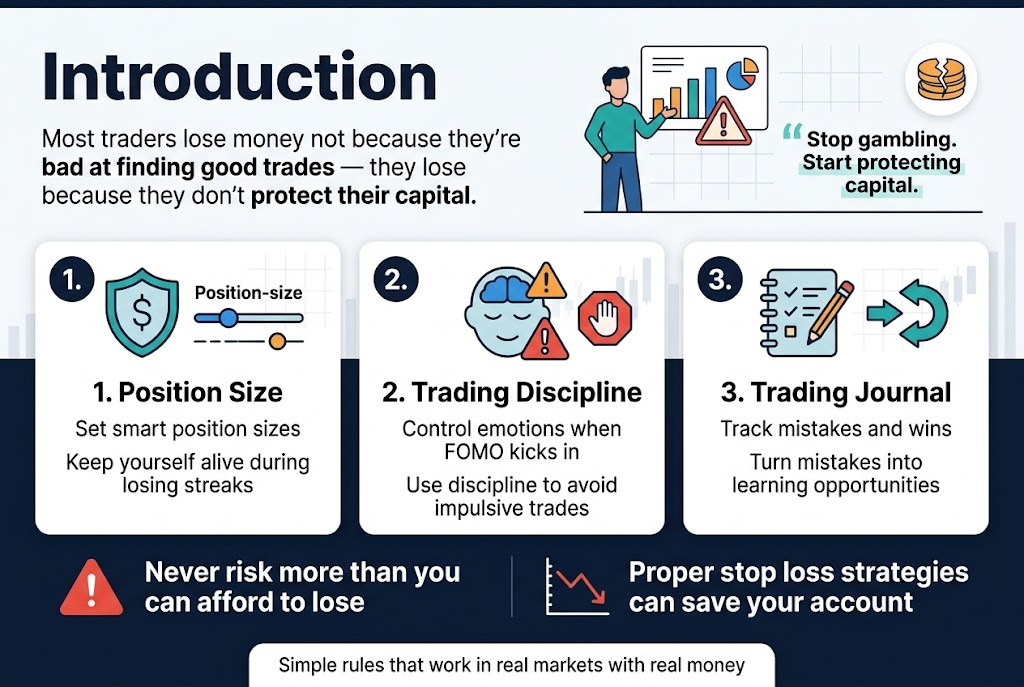
Most traders lose money not because they’re bad at finding good trades — they lose because they don’t protect their capital. I learned this the hard way after blowing up my first two accounts chasing quick profits.
This guide is for new and intermediate traders who want to stop gambling and start building consistent profits. You’ll discover the exact trading risk management rules I use daily to protect my portfolio, including why you should never risk more than you can afford to lose and how proper stop loss trading strategies can save your account when markets turn ugly.
We’ll break down three critical areas: setting smart position sizes that keep you alive during losing streaks, using trading discipline techniques to control your emotions when FOMO kicks in, and maintaining a trading journal that turns mistakes into learning opportunities.
These aren’t complicated Wall Street theories — they’re simple rules that work in real markets with real money.
Never Risk More Than You Can Afford to Lose
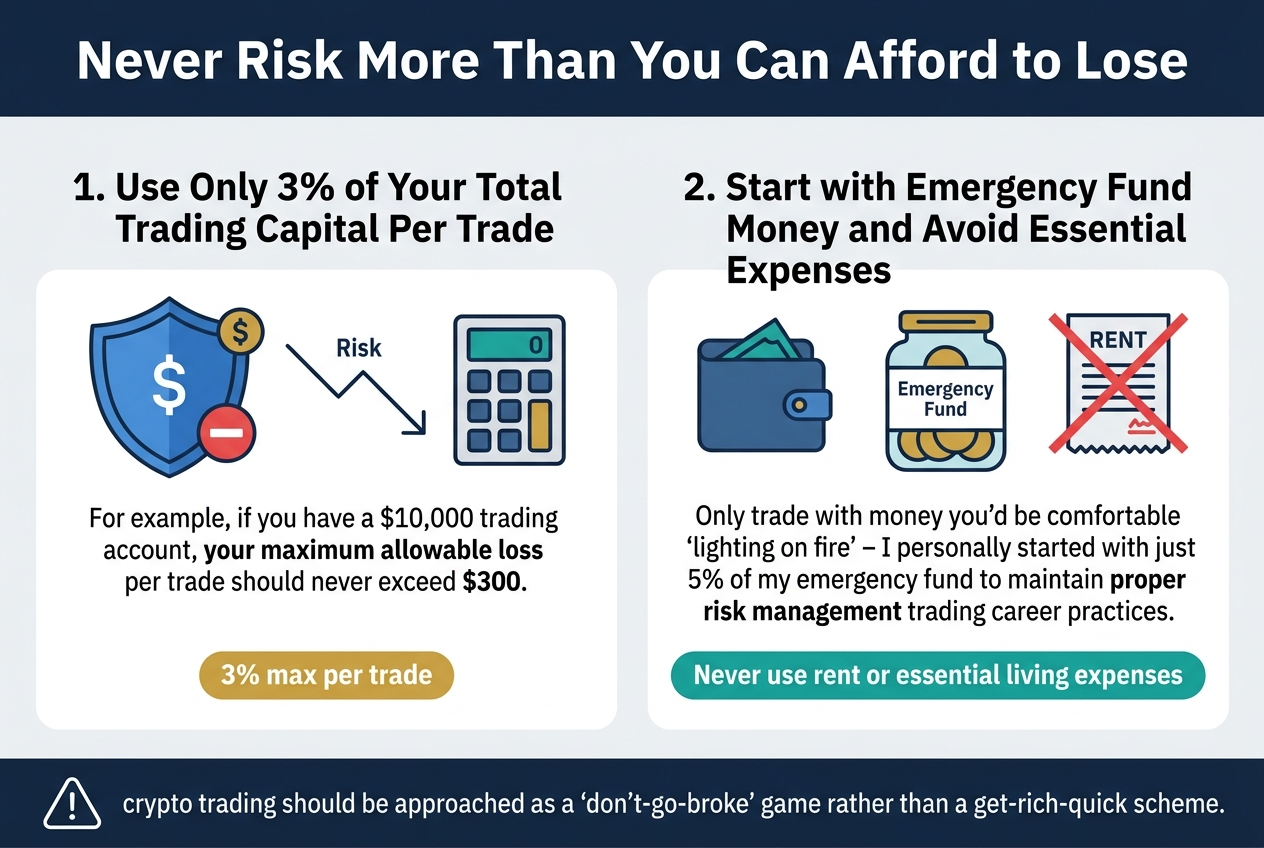
Use Only 3% of Your Total Trading Capital Per Trade
The cornerstone of effective trading risk management strategies for traders is limiting exposure to just 3% of your total trading capital on any single trade. For example, if you have a $10,000 trading account, your maximum allowable loss per trade should never exceed $300. This disciplined approach ensures that even a series of losing trades won’t devastate your account.
Start with Emergency Fund Money and Avoid Essential Expenses
Only trade with money you’d be comfortable “lighting on fire” – I personally started with just 5% of my emergency fund to maintain proper risk management trading career practices. Never use funds designated for rent or essential living expenses, as crypto trading should be approached as a “don’t-go-broke” game rather than a get-rich-quick scheme.
Always Set and Honor Stop-Loss Orders
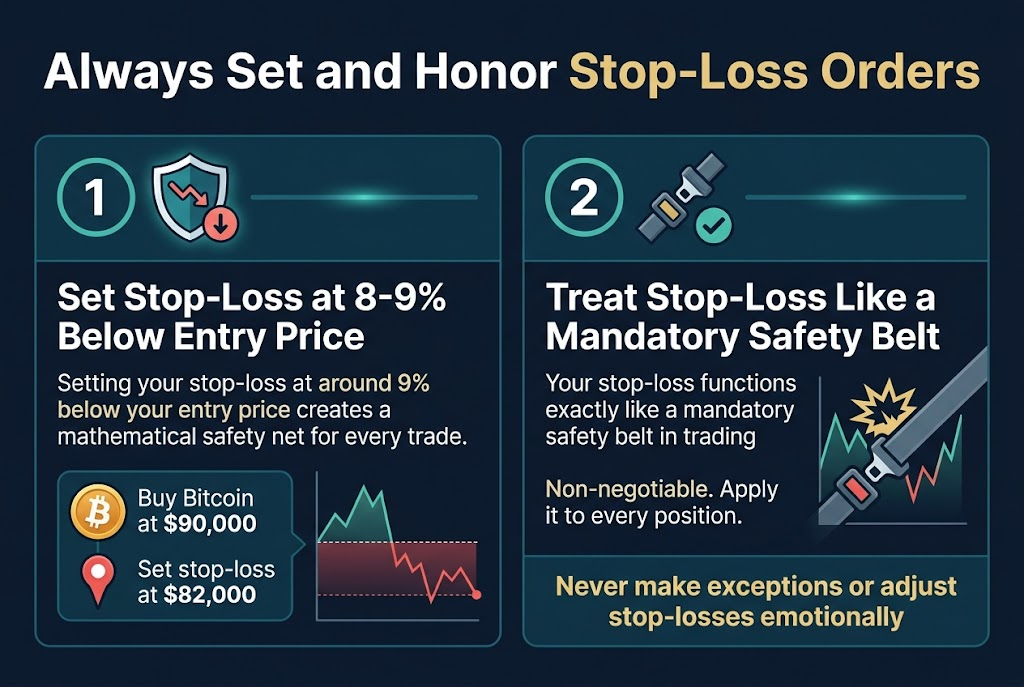
Set Stop-Loss at 8-9% Below Entry Price
Setting your stop-loss at around 9% below your entry price creates a mathematical safety net for every trade. For example, if you buy Bitcoin at $90,000, set a stop-loss at $82,000. This specific percentage provides enough room for normal market fluctuations while protecting you from devastating losses that could cripple your trading account.
Treat Stop-Loss Like a Mandatory Safety Belt
Your stop-loss functions exactly like a mandatory safety belt in trading—you hope you never need it, but it saves you when a crash happens. This stop loss trading strategy should be non-negotiable, applied to every position without exception. The moment you start making exceptions or adjusting your stop-losses during emotional moments, you compromise the very foundation of sound trading risk management rules that protect your capital.
Diversify Your Portfolio Strategically
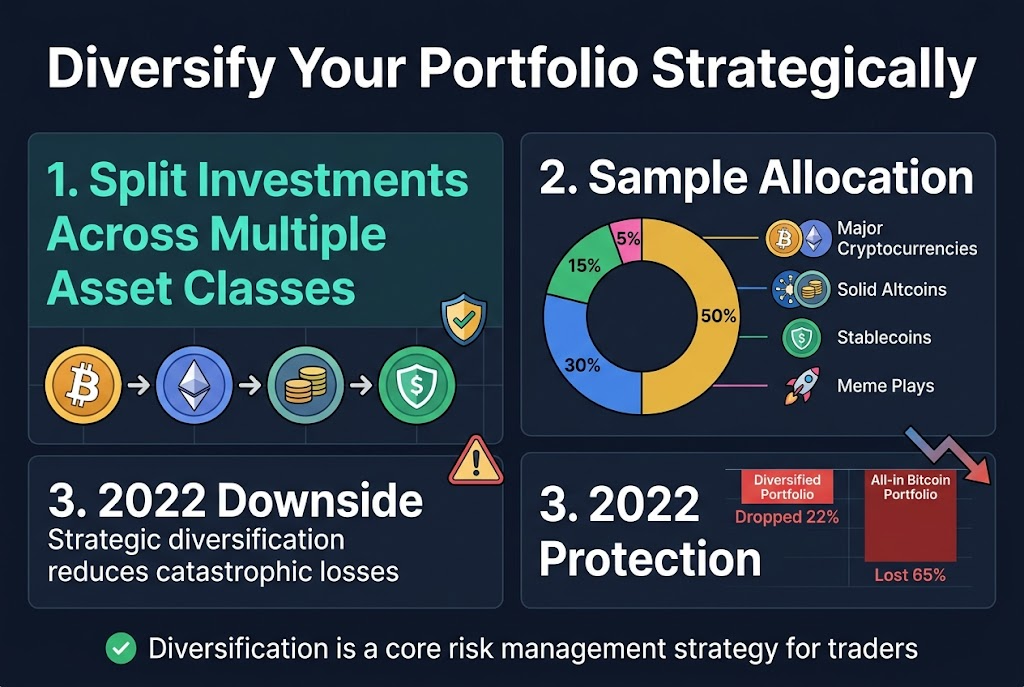
Split Investments Across Multiple Asset Classes
Strategic trading portfolio diversification serves as your primary defense against catastrophic losses. By splitting investments across multiple asset classes, you prevent your entire portfolio from catching a cold if one asset sneezes. This approach becomes crucial when implementing comprehensive risk management strategies for traders.
Allocate 50% to Major Cryptocurrencies, 30% to Solid Altcoins
A proven allocation strategy involves dedicating 50% to major cryptocurrencies like Bitcoin and Ethereum, while directing 30% toward solid altcoins such as Solana or Chainlink. Keep 15% in stablecoins for safety and reserve 5% for fun meme plays. This diversified portfolio dropped only 22% in 2022 when everything crashed, while an all-in-Bitcoin portfolio lost 65%.
Control Total Portfolio Exposure
Limit Total Risk Across All Positions
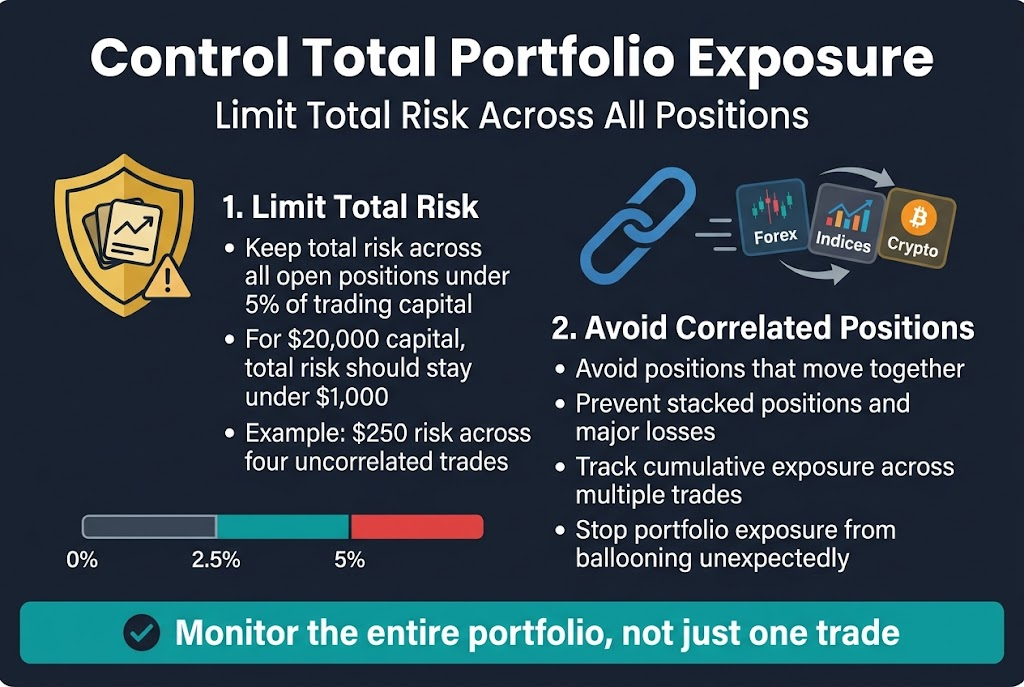
Previously, I’ve established that individual trade risk must be controlled, but portfolio risk control extends beyond single positions. Limiting total risk across all open positions to under 5% of your trading capital creates a crucial safety net. For instance, on a $20,000 capital, total risk should stay under $1,000, perhaps $250 across four uncorrelated trades.
Avoid Correlated Positions and Track Cumulative Exposure
Now that we have covered individual position sizing, avoiding correlated positions that move together becomes essential for effective risk management strategies for traders. This prevents stacked positions and major losses if markets move together across Forex pairs, indices, or crypto. Tracking cumulative exposure across multiple trades ensures portfolio risk control across the entire portfolio, not just one trade, preventing portfolio exposure from ballooning unexpectedly.
Use Leverage Sparingly and Carefully
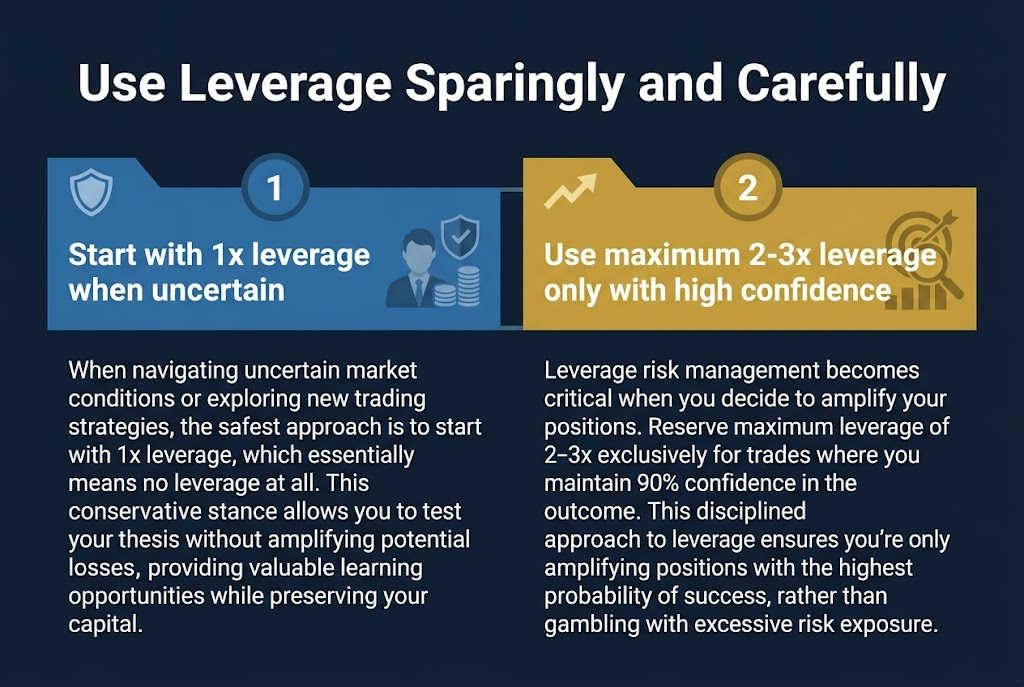
Start with 1x leverage when uncertain
When navigating uncertain market conditions or exploring new trading strategies, the safest approach is to start with 1x leverage, which essentially means no leverage at all. This conservative stance allows you to test your thesis without amplifying potential losses, providing valuable learning opportunities while preserving your capital.
Use maximum 2-3x leverage only with high confidence
Leverage risk management becomes critical when you decide to amplify your positions. Reserve maximum leverage of 2-3x exclusively for trades where you maintain 90% confidence in the outcome. This disciplined approach to leverage ensures you’re only amplifying positions with the highest probability of success, rather than gambling with excessive risk exposure.
Maintain a Detailed Trading Journal
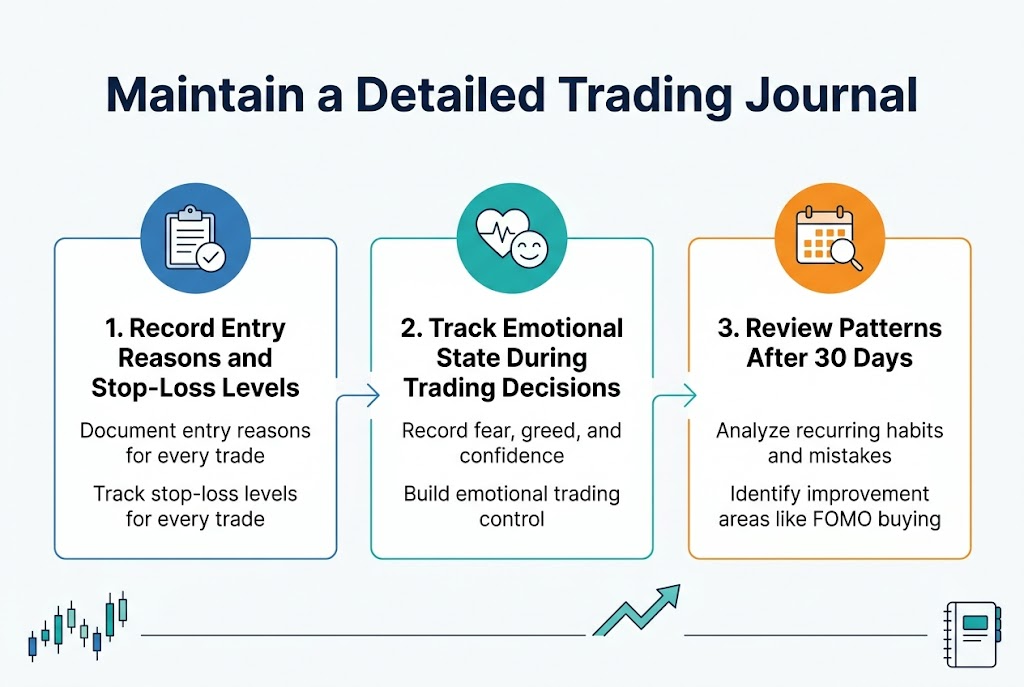
Record entry reasons and stop-loss levels for every trade
Documenting entry reasons and stop-loss levels for every trade forms the foundation of effective trading journal best practices. This meticulous record-keeping transforms your trading from guesswork into a systematic approach, allowing you to analyze what drove each decision and whether your risk management strategies for traders actually worked.
Track emotional state during trading decisions
Recording your emotional state during trading decisions helps transform you from an emotional gambler to a calm trader. By noting feelings like fear, greed, or confidence alongside each trade, you develop crucial emotional trading control that separates successful traders from those who let emotions dictate their decisions.
Review patterns after 30 days to identify improvement areas
After 30 days of consistent journaling, review your patterns to identify improvement areas such as consistently FOMO buying on weekends. This systematic analysis reveals recurring behavioral issues that undermine your trading discipline techniques, enabling you to fix these habits and strengthen your overall risk management approach.
Master Emotional Control and Discipline
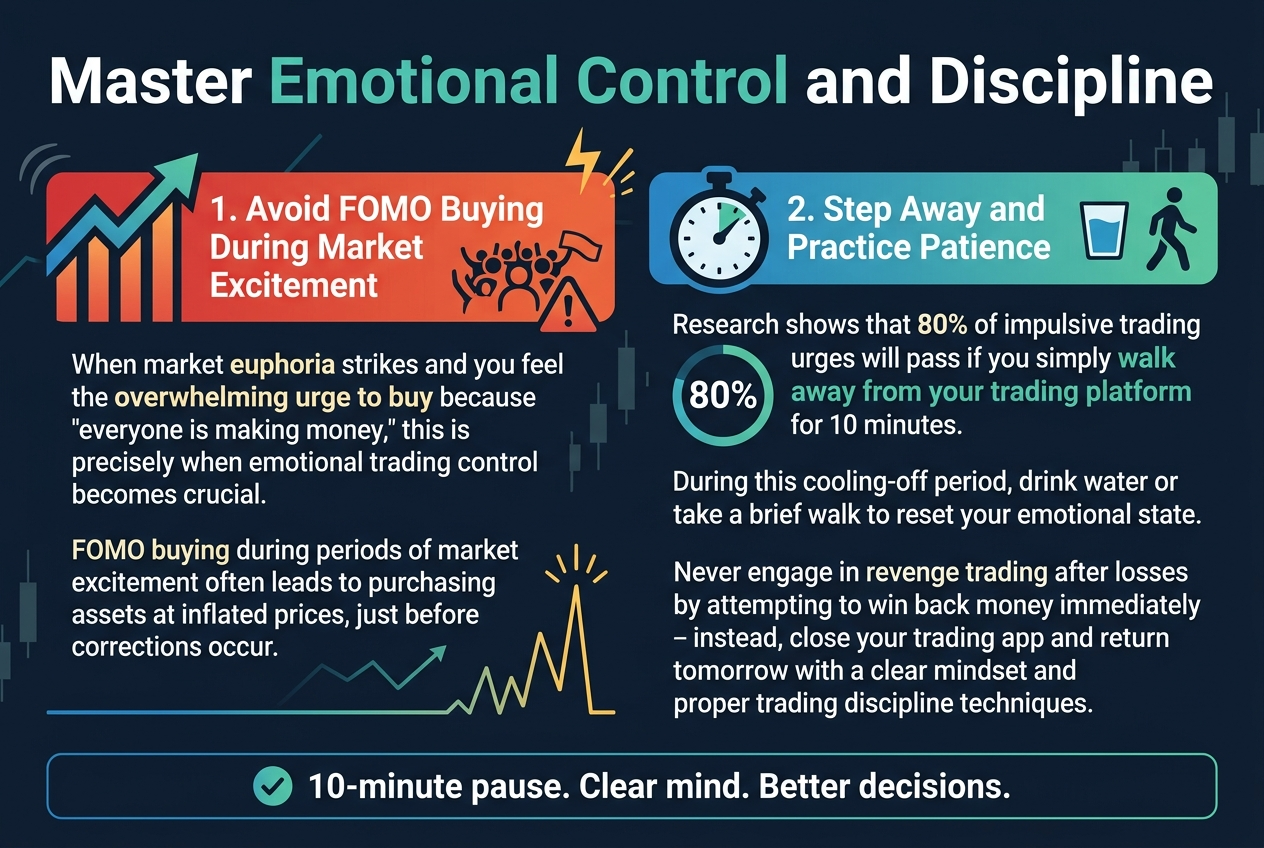
Avoid FOMO Buying During Market Excitement
When market euphoria strikes and you feel the overwhelming urge to buy because “everyone is making money,” this is precisely when emotional trading control becomes crucial. FOMO buying during periods of market excitement often leads to purchasing assets at inflated prices, just before corrections occur. The most effective trading discipline technique is to step away for 10 minutes when these intense feelings arise.
Step Away and Practice Patience
Research shows that 80% of impulsive trading urges will pass if you simply walk away from your trading platform for 10 minutes. During this cooling-off period, drink water or take a brief walk to reset your emotional state. This simple risk management strategy for traders prevents costly emotional decisions. Never engage in revenge trading after losses by attempting to win back money immediately – instead, close your trading app and return tomorrow with a clear mindset and proper trading discipline techniques.
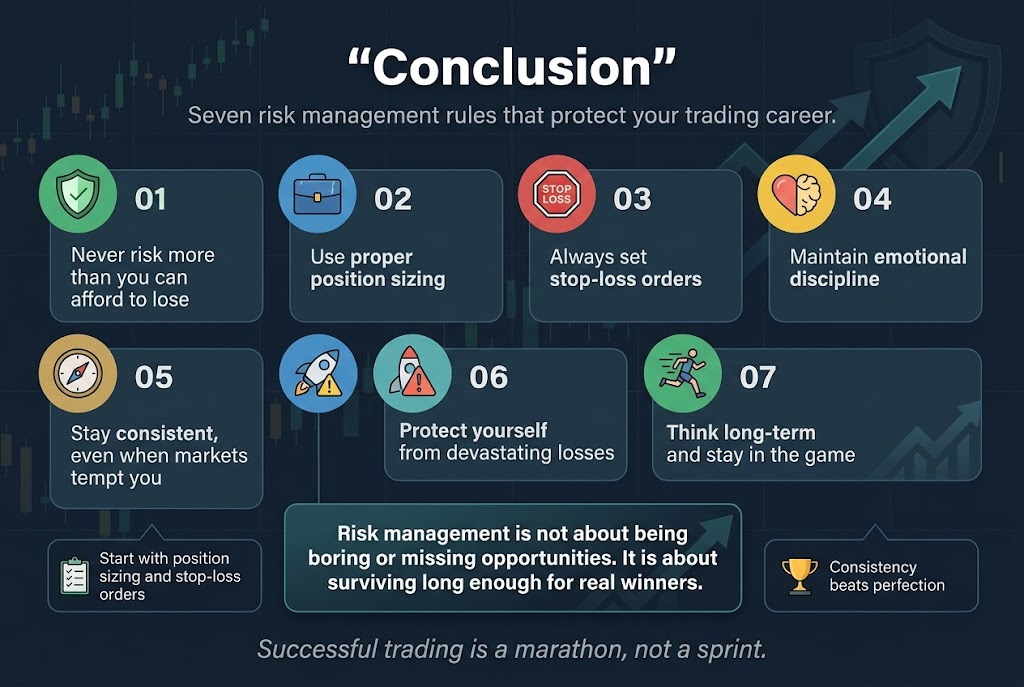
These seven risk management rules aren’t just theoretical concepts—they’re battle-tested strategies that have saved countless trading careers, including my own. From never risking more than you can afford to lose to maintaining emotional discipline, each rule works together to create a comprehensive defense system for your portfolio. The key isn’t perfection; it’s consistency in applying these principles even when the market tempts you to abandon them.
Risk management isn’t about being boring or missing out on opportunities. It’s about staying in the game long enough to capitalize on the real winners while protecting yourself from devastating losses. Start implementing these rules gradually, beginning with proper position sizing and stop-loss orders. Your future self will thank you when you’re still trading profitably while others have blown up their accounts chasing quick gains. Remember, successful trading is a marathon, not a sprint—and these rules are your training plan for long-term success.