Why 95% of Traders Fail: The Psychology Behind Market Losses
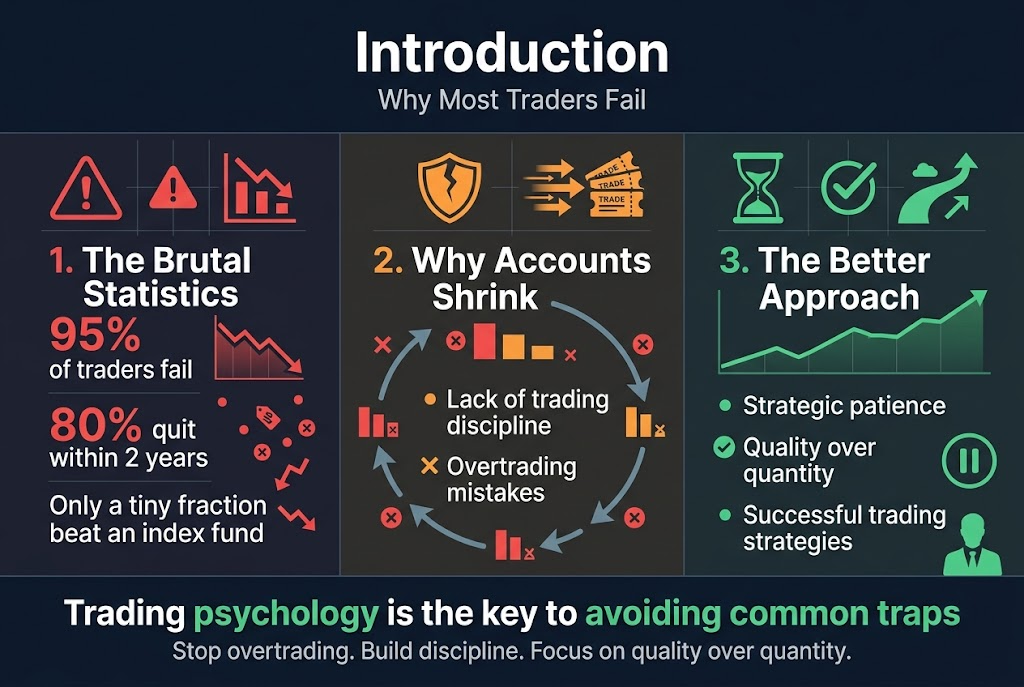
Most traders believe they’ll beat the market, but here’s the harsh reality: 95% of traders fail and lose money consistently. The statistics are brutal – 80% quit within two years, and only a tiny fraction ever outperform a simple index fund.
This guide is for anyone who’s considering trading or already struggling with market losses. Whether you’re a beginner drawn to quick profits or an experienced trader wondering why your account keeps shrinking, understanding trading psychology is the key to avoiding the common traps that destroy accounts.
We’ll break down the real reasons behind trading failure statistics and explore how overtrading mistakes and lack of trading discipline create a deadly cycle that wipes out most traders. You’ll discover why short term trading risks are so high and learn the successful trading strategies that separate winners from losers.
First, we’ll examine the shocking data behind why most traders fail and identify the primary destroyer of trading accounts: lack of discipline. Then we’ll dive into the fatal flaw of overtrading and reveal why ultra-short term trading creates an almost impossible game to win. Finally, we’ll explore the power of strategic patience and show you how to transform your relationship with market action using quality over quantity.
The Shocking Statistics Behind Trading Failure
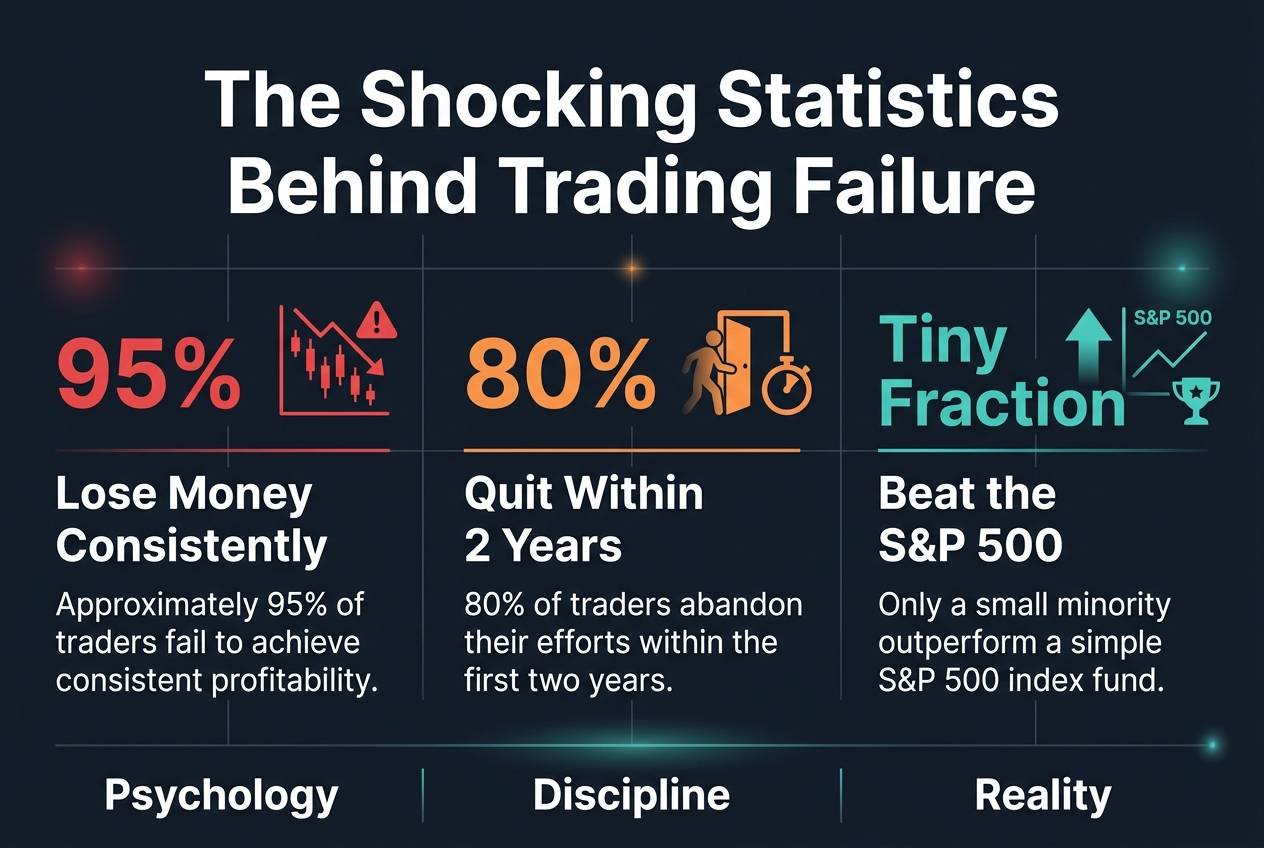
Why 95% of traders lose money consistently
Academic research and brokerage data reveal a stark reality: approximately 95% of traders fail to achieve consistent profitability. This staggering trading failure statistics stems from psychological factors and poor decision-making rather than market complexity alone. The data consistently shows that the vast majority of retail traders struggle with trading psychology, leading to systematic market losses that compound over time.
The 80% quit rate within first two years
The harsh reality of trading becomes evident quickly, with 80% of traders abandoning their efforts within the first two years. This high attrition rate reflects the emotional toll of repeated losses and the realization that successful trading strategies require more discipline than most anticipated. Why do traders fail so rapidly? The answer lies in unrealistic expectations meeting the brutal reality of market volatility and their inability to maintain proper trading discipline.
How few traders actually beat index funds
Perhaps most telling is that only a tiny fraction of traders ever outperform a simple S&P 500 index fund. This sobering fact challenges the fundamental premise of active trading, as the majority who attempt to beat the market through frequent transactions end up underperforming passive investment strategies significantly.
Lack of Discipline: The Primary Destroyer of Trading Accounts
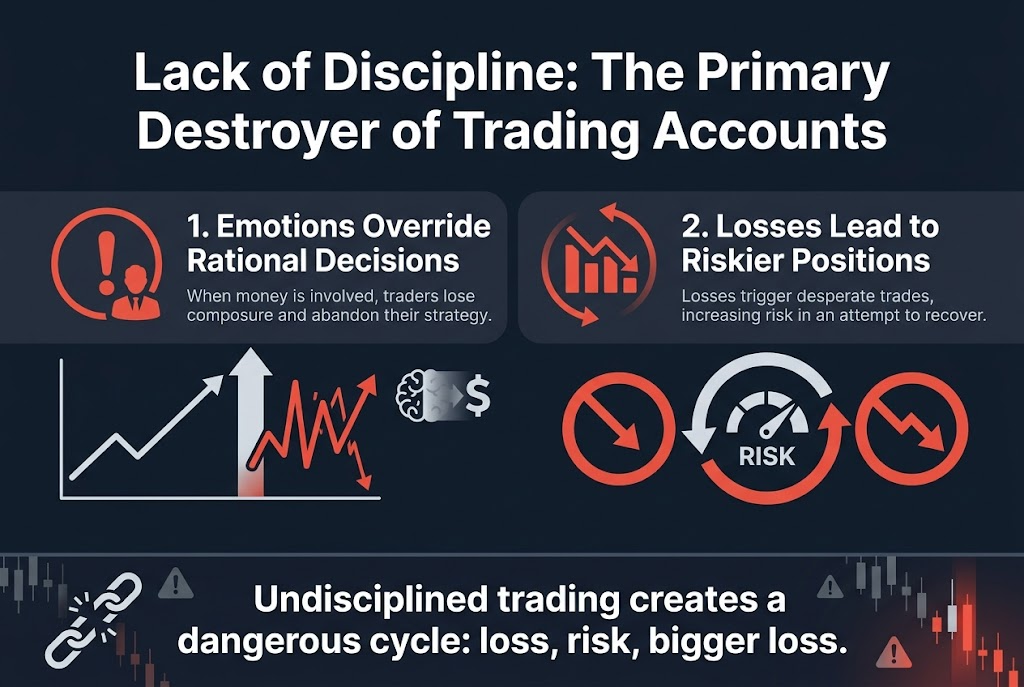
How emotions override rational decision-making when money is involved
Without discipline, traders struggle to maintain composure and stick to their strategy, often acting emotionally when money is involved. This emotional override becomes the foundation of trading psychology failures, as rational decision-making processes become compromised whenever financial stakes are present.
The dangerous cycle of losses leading to riskier positions
A lack of discipline often leads to losses, prompting traders to take riskier positions to try and recoup those losses, creating a common dangerous cycle. This pattern demonstrates why trading discipline remains fundamental, as undisciplined traders continuously escalate their risk exposure in desperate attempts to recover previous market losses.
The Fatal Flaw of Overtrading
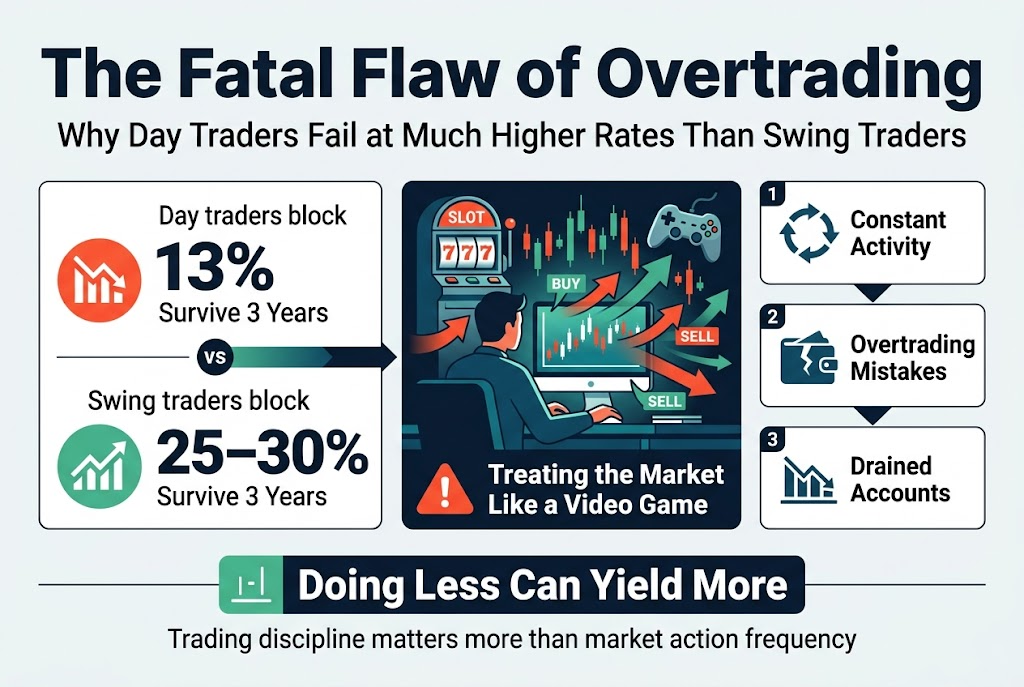
Why Day Traders Fail at Much Higher Rates Than Swing Traders
The statistics reveal a stark reality: only about 13% of day traders survive three years in the markets, compared to 25-30% of swing traders. This dramatic difference in survival rates highlights how short-term trading approaches significantly increase failure rates and trading psychology challenges.
How Treating the Market Like a Video Game Destroys Accounts
Day traders habitually overtrade, often treating the market like a video game where constant activity is perceived as necessary for survival. This gaming mentality creates overtrading mistakes that systematically drain trading accounts. Many traders incorrectly believe that increased activity will lead to more profits, but the paradox of trading often shows that doing less can yield more, emphasizing the critical importance of trading discipline over market action frequency.
The Time Frame Trap: Why Ultra-Short Term Trading Fails
How intraday volatility creates random, unpredictable outcomes
Intraday volatility generates extremely random and unpredictable market movements that make consistent profit generation nearly impossible. These short-term price fluctuations operate independently of fundamental market forces, creating an environment where even the most sophisticated trading strategies fail to produce reliable results.
Why technical analysis breaks down in ultra-short time frames
Standard technical analysis becomes ineffective in ultra-short time frames because traders are essentially trading the emotions and reactions of other market participants rather than meaningful price patterns. The emotional noise overwhelms traditional technical indicators, making it impossible to distinguish between genuine market signals and random price movements that characterize short term trading risks.
The Batting Average Problem
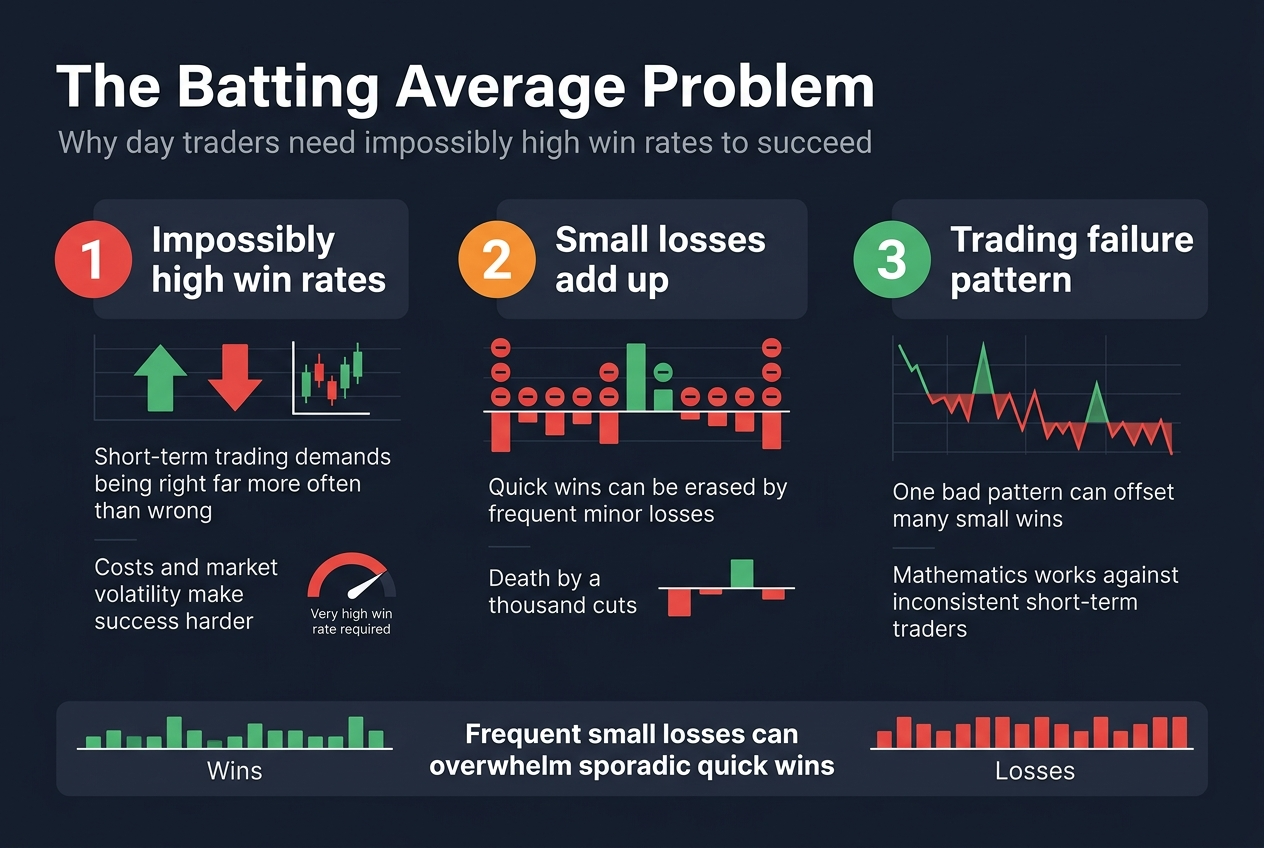
Why day traders need impossibly high win rates to succeed
Day traders face a mathematical nightmare that explains why do traders fail at such alarming rates. The structure of short-term trading demands an impossibly high win rate to overcome the inherent costs and market volatility. Unlike longer-term strategies, day trading requires traders to be right significantly more often than wrong, creating an unsustainable pressure that contributes to widespread trading failure statistics.
How small losses consistently offset quick wins
The trading psychology behind market losses becomes evident when examining how frequent small defeats systematically erode quick profits. Even when day traders achieve rapid gains, the cumulative effect of numerous minor losses creates a devastating pattern. This death by a thousand cuts phenomenon demonstrates why successful trading strategies must account for the mathematical reality that small, consistent losses will inevitably offset sporadic wins in short term trading environments.
The Power of Strategic Patience
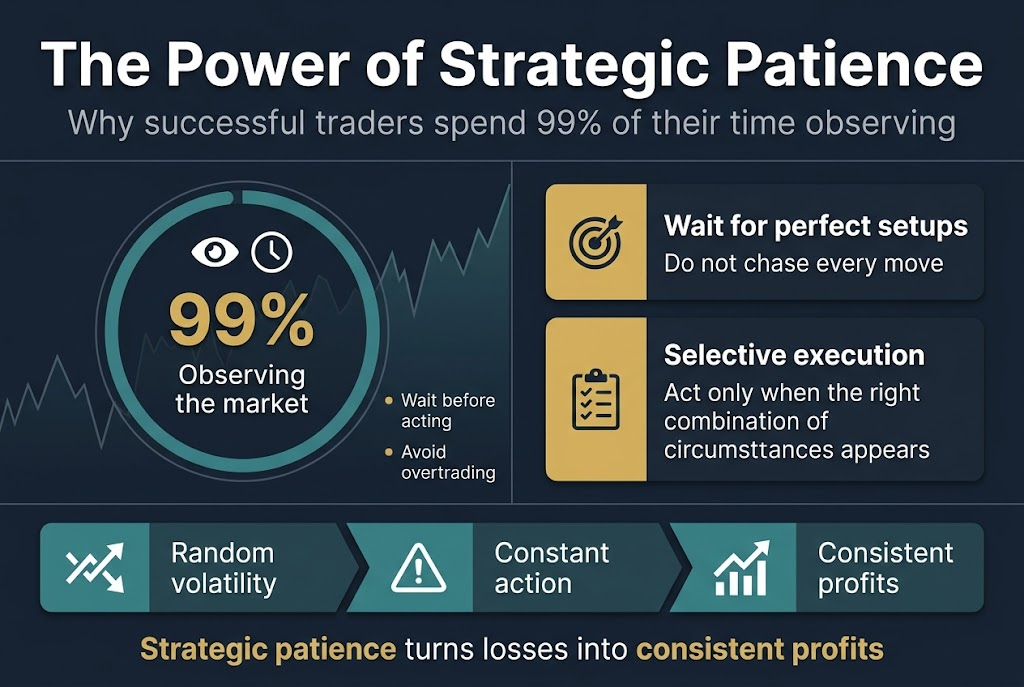
Why successful traders spend 99% of their time observing
Highly successful traders demonstrate the ability to go long periods doing very little, spending time observing the market. This strategic patience separates winning traders from those who fall into overtrading mistakes and constant market action.
How waiting for perfect setups dramatically improves results
Instead of constantly trying to time exact turning points or betting on random volatility, successful traders wait for the right combination of circumstances and strategic setups. This disciplined approach to trading psychology transforms market losses into consistent profits through selective execution.
Quality Over Quantity: The Winning Formula
Why managing fewer high-conviction positions beats diversification
It is much easier and more effective to manage a few high-conviction positions than numerous mediocre ones. Successful traders understand that spreading attention across dozens of trades dilutes focus and reduces the ability to properly monitor each position. By concentrating on fewer opportunities, traders can dedicate more time to thorough analysis and risk management.
How to identify when technical setups, fundamentals, and sentiment align
Successful traders seek moments when multiple factors converge to create high-probability trading opportunities. This alignment creates the ideal conditions for taking larger, more confident positions rather than gambling on uncertain setups that lack proper confirmation across different analytical dimensions.
Transforming Your Relationship with Market Action
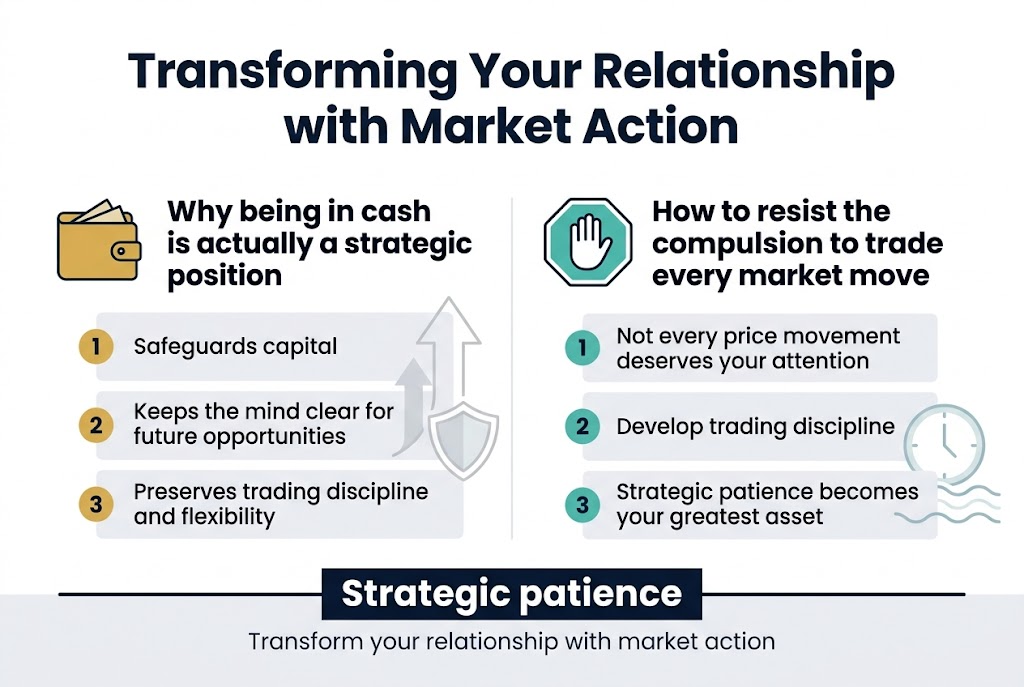
Why being in cash is actually a strategic position
Being in cash is a strategic, proactive choice that safeguards capital and keeps the mind clear for future opportunities. Many traders fail to recognize that holding cash represents active portfolio management rather than missed opportunity. This position allows traders to preserve their trading discipline while maintaining the flexibility to act when truly exceptional setups emerge.
How to resist the compulsion to trade every market move
The compulsion to trade every market move stems from the psychological need for constant action, yet successful trading requires the wisdom to recognize when markets don’t present viable opportunities. Developing trading discipline means understanding that not every price movement deserves your attention or capital allocation. Strategic patience becomes your greatest asset when you transform your relationship with market action.
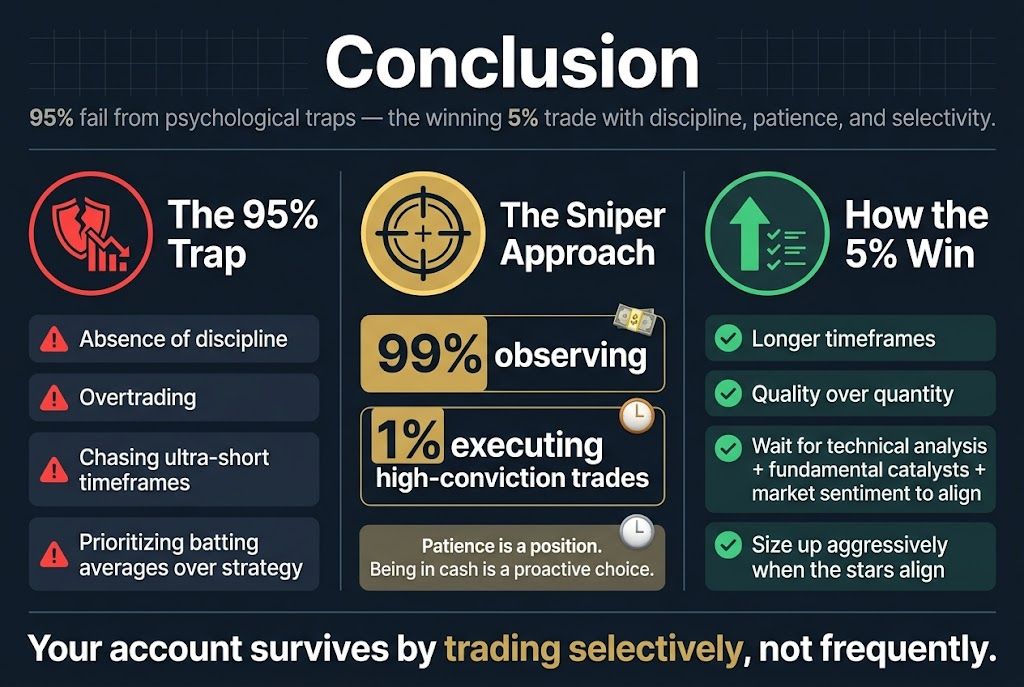
The harsh reality is that 95% of traders fail not because the market is rigged against them, but because they fall victim to predictable psychological traps. The primary destroyer of trading accounts isn’t market volatility or lack of intelligence—it’s the absence of discipline that leads to overtrading, chasing ultra-short timeframes, and prioritizing batting averages over strategic patience. While day traders require impossibly high win rates to succeed, those who embrace longer timeframes and quality over quantity can become part of the winning minority.
The path to joining the successful 5% requires a fundamental shift in your relationship with the market. Instead of treating trading like a video game where constant action is required, adopt the sniper approach: spend 99% of your time observing and 1% executing high-conviction trades. Remember that patience is a position, being in cash is a proactive choice, and the paradox of trading is that doing less often earns you more. Transform your approach by waiting for quality setups where technical analysis, fundamental catalysts, and market sentiment align—then size up aggressively when the stars align. Your trading account’s survival depends not on how often you trade, but on how selectively you choose your battles.