Trading Case Studies: Lessons from the World’s Best Traders
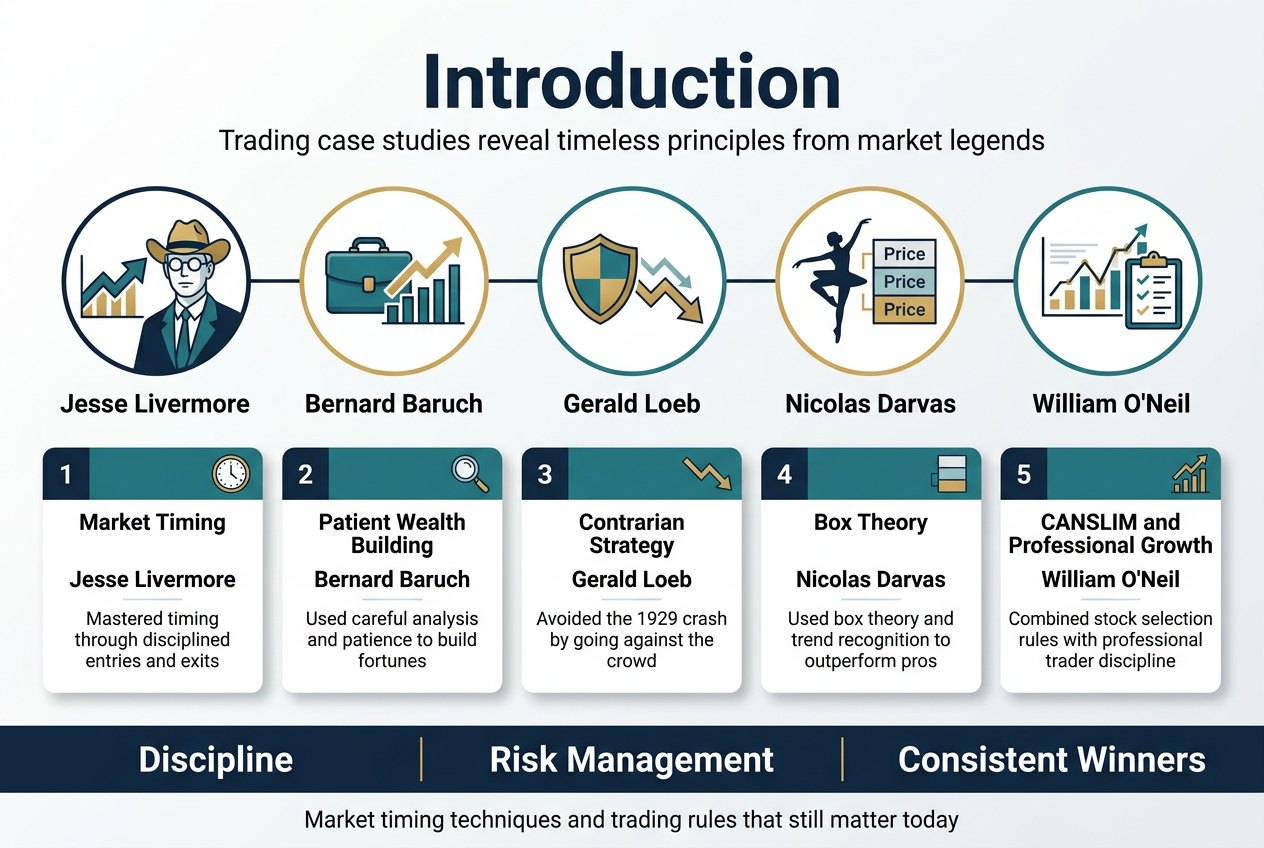
Ever wondered what separates legendary traders who built fortunes from those who lost everything? Trading case studies reveal the timeless principles that turned ordinary people into market masters across a century of bull and bear markets.
This guide is for aspiring traders, retail investors, and finance professionals who want to learn from proven winners rather than repeat costly mistakes. You’ll discover how famous traders like Jesse Livermore and Bernard Baruch developed their edge through disciplined analysis and risk management.
We’ll examine Jesse Livermore trading strategies that helped “The Boy Plunger” master market timing despite multiple setbacks. You’ll learn Bernard Baruch investment principles for building wealth through patient analysis. We’ll also explore contrarian trading strategies used by Gerald Loeb to sidestep the 1929 crash, plus Nicolas Darvas box theory that let a dancer beat Wall Street pros in his spare time.
Finally, we’ll cover William O’Neil CANSLIM method and essential elements of professional trader development that separate consistent winners from the crowd. These market timing techniques and trading rules for success have worked across different economic cycles and remain relevant for today’s markets.
Profile of Jesse Livermore: The Boy Plunger Who Mastered Market Timing
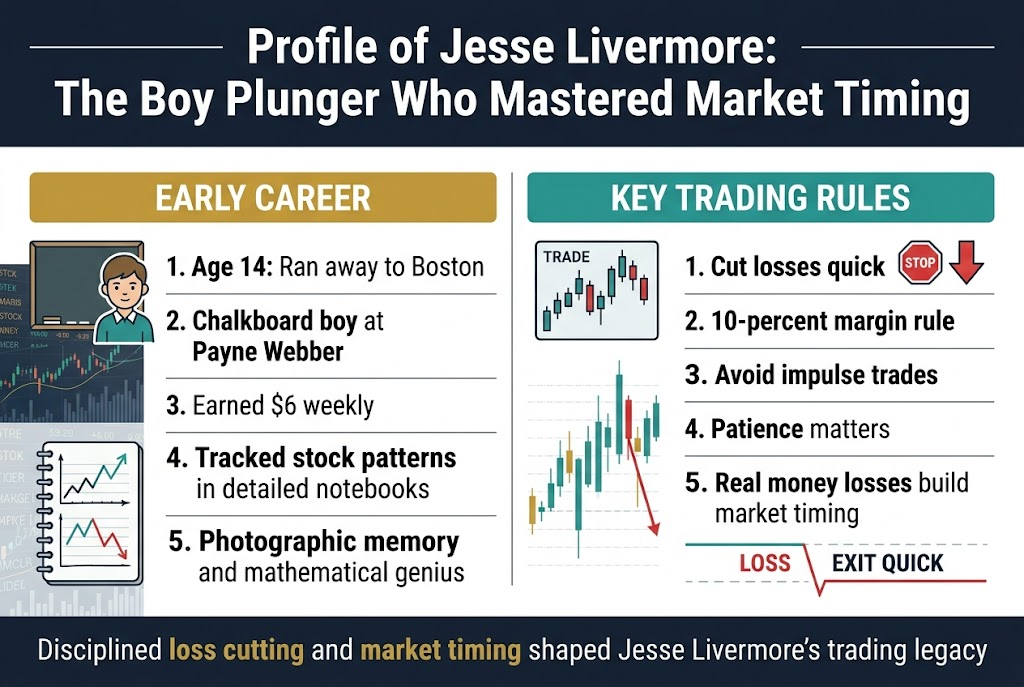
Early Career: From Chalkboard Boy to Bucket Shop Success
Jesse Livermore’s journey from poverty to trading case studies legend began at age 14 when he fled home to Boston, securing a position as a chalkboard boy at Payne Webber for $6 weekly. His mathematical genius and photographic memory allowed him to meticulously track stock patterns, maintaining detailed notebooks of price movements that would later inform his Jesse Livermore trading strategies.
Key Trading Rules: Cut Losses Quick and Master the Time Element
The bucket shop’s 10-percent margin rule became Livermore’s foundation for strict loss-cutting discipline, a principle he refined throughout his career by cutting losses even quicker. His early experiences taught him that impatience leads to costly impulse trades, and that experiencing real money losses was essential for understanding true market dynamics and developing proper market timing techniques.
Bernard Baruch: Building Wealth Through Disciplined Market Analysis
Foundation Lessons from a $5 Weekly Wall Street Job
Bernard Baruch’s journey began with humble origins, earning just $5 per week as a Wall Street clerk. This foundational experience provided him with crucial insights into market mechanics and the importance of disciplined analysis over speculation. His early exposure to market operations shaped his methodical approach to investment research and risk management.
Techniques for Sidestepping Major Market Crashes
Strategic Short Positioning During Market Weakness
Congressional Recognition and Market Influence
Baruch’s disciplined market analysis and strategic positioning eventually earned him recognition as one of Wall Street’s most respected voices. His investment principles and market insights became so influential that he was frequently consulted by government officials and fellow investors seeking guidance during turbulent market periods.
Gerald Loeb: The Contrarian Who Avoided the 1929 Crash
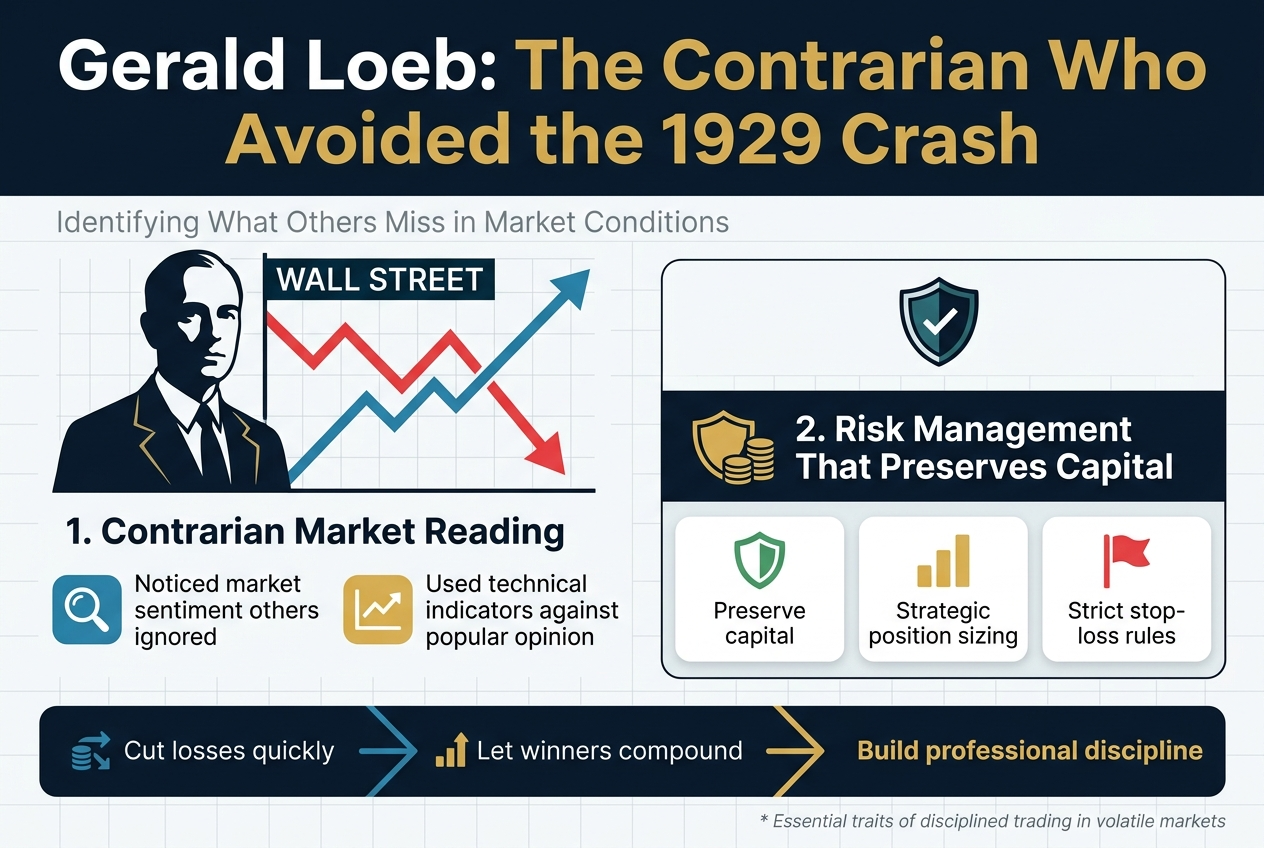
Identifying What Others Miss in Market Conditions
Gerald Loeb’s contrarian trading strategies distinguished him as one of Wall Street’s most astute investors during the early 20th century. His ability to identify market conditions that others overlooked became legendary when he successfully navigated the 1929 crash through careful analysis of underlying market sentiment and technical indicators that contradicted popular opinion.
Risk Management Strategies That Preserve Capital
Loeb’s risk management approach centered on preserving capital through strategic position sizing and strict stop-loss protocols. His disciplined market analysis emphasized cutting losses quickly while allowing profitable positions to compound, demonstrating the essential elements of professional trader development that separate winners from losers in volatile market environments.
Nicolas Darvas: The Dancing Outsider Who Beat Wall Street Pros
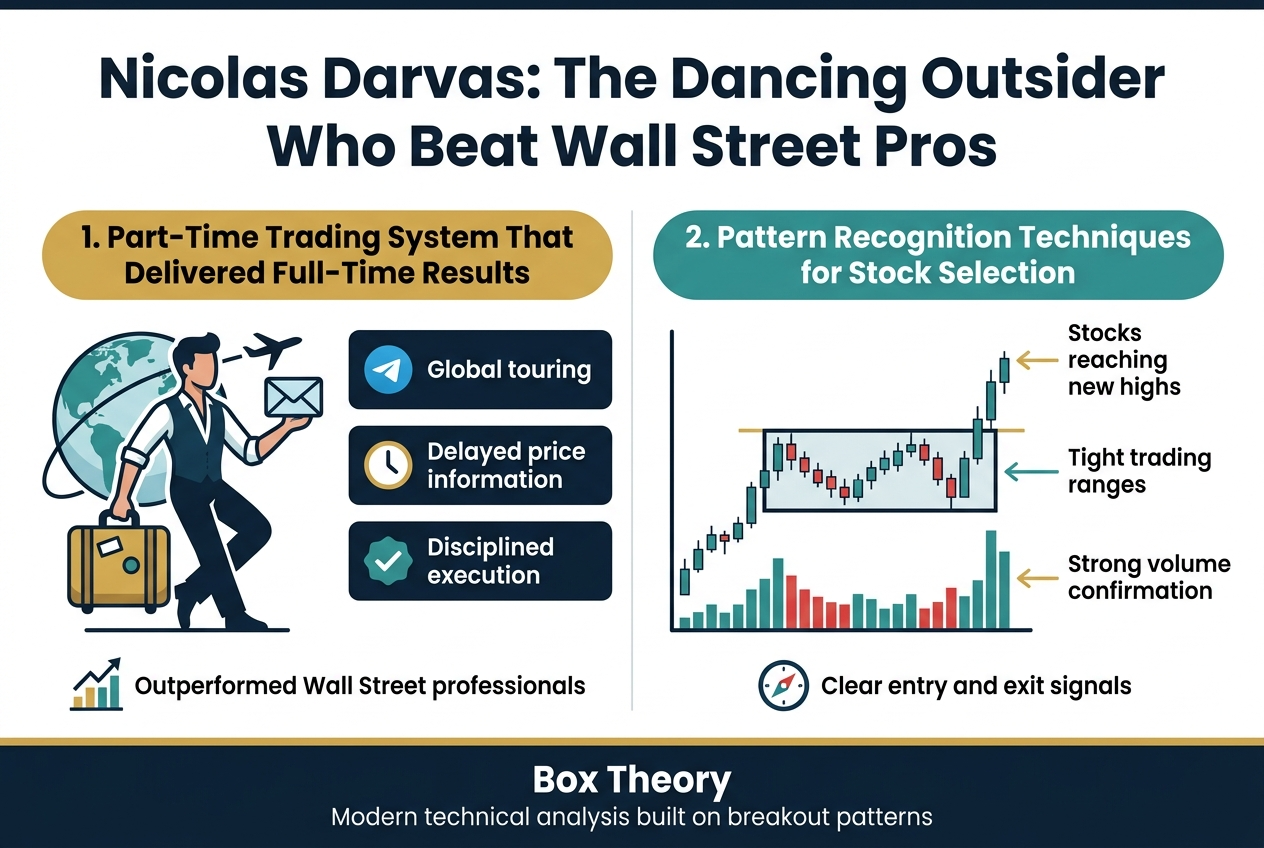
Part-Time Trading System That Delivered Full-Time Results
Nicolas Darvas revolutionized trading case studies by proving that geographical distance and limited market access couldn’t prevent extraordinary success. As a professional dancer touring globally, he developed a systematic approach that relied on telegrams and delayed price information, yet consistently outperformed full-time Wall Street professionals through disciplined execution.
Pattern Recognition Techniques for Stock Selection
Darvas’s famous box theory became a cornerstone of modern technical analysis, identifying stocks that broke through resistance levels with strong volume confirmation. His pattern recognition focused on stocks reaching new highs while maintaining tight trading ranges, creating clear entry and exit signals that minimized emotional decision-making and maximized profit potential in trending markets.
William O’Neil: Modern Success Through Time-Honored Principles
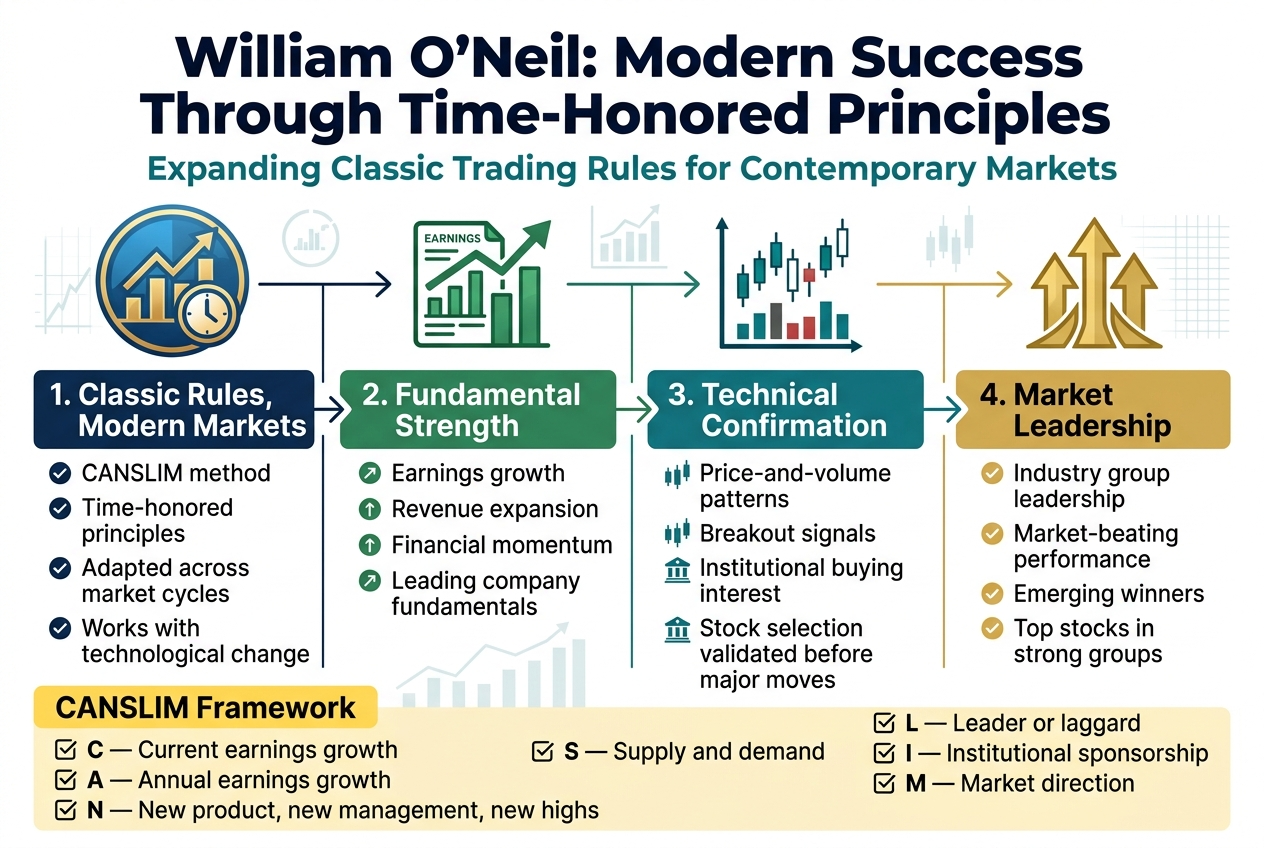
Expanding Classic Trading Rules for Contemporary Markets
William O’Neil’s CANSLIM method demonstrates how time-honored trading principles can be successfully adapted for modern markets. His systematic approach combines fundamental strength indicators with technical chart patterns, creating a framework that remains relevant across different market cycles and technological advances.
Fundamental Analysis Integration with Technical Patterns
O’Neil’s methodology seamlessly blends earnings growth analysis with price-and-volume patterns to identify emerging market leaders. This dual approach validates stock selection decisions by confirming both financial strength and institutional buying interest before major price movements occur.
Industry Group Leadership Identification Methods
Stock Selection Criteria for Market-Beating Performance
Essential Elements of Professional Trader Development Programs
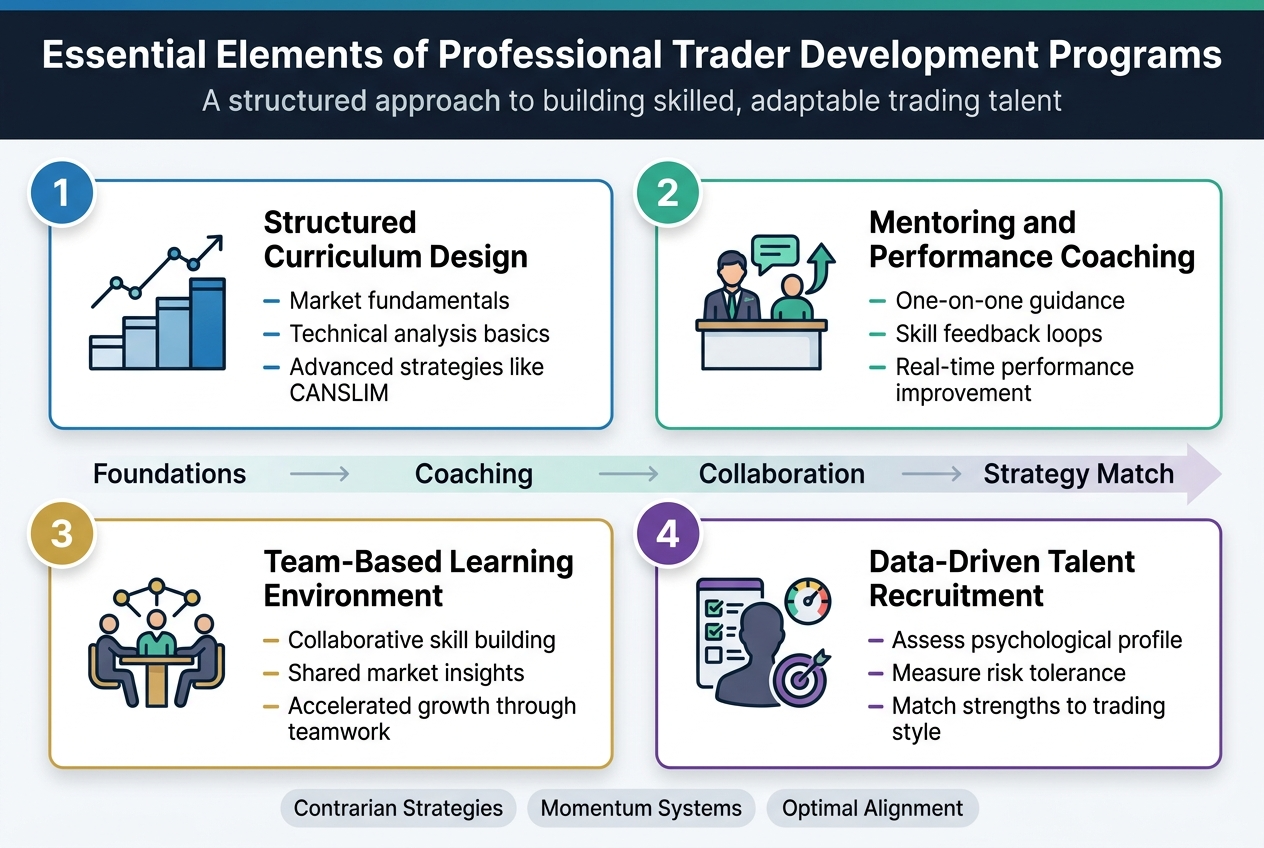
Structured Curriculum Design from Basic Knowledge to Advanced Skills
Now that we have examined the trading methodologies of legendary traders like Jesse Livermore and Bernard Baruch, professional trader development programs must establish systematic learning progressions. Effective curricula begin with market fundamentals and technical analysis basics before advancing to sophisticated strategies like the CANSLIM method pioneered by William O’Neil.
Integration of Mentoring and Performance Coaching Systems
Team-Based Learning Environment for Accelerated Growth
Data-Driven Talent Recruitment for Optimal Strategy Matching
Professional trading development requires strategic matching of individual strengths to proven trading methodologies. Programs assess candidates’ psychological profiles, risk tolerance, and analytical capabilities to determine optimal alignment with specific approaches, whether contrarian strategies or momentum-based systems like Nicolas Darvas’s box theory.
Common Trading Rules That Separate Winners from Losers
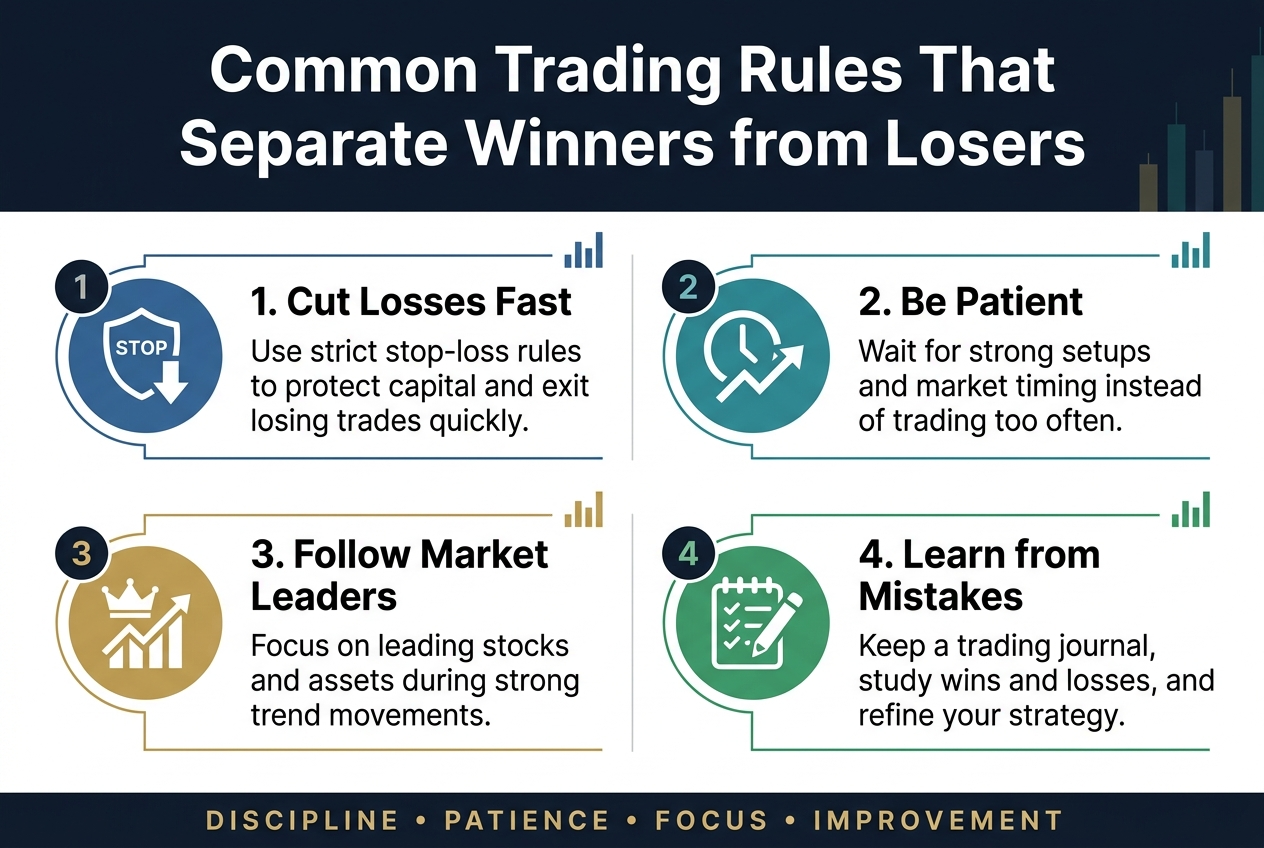
Loss-Cutting Discipline and Position Management
The most successful traders consistently implement strict stop-loss protocols to preserve capital during unfavorable market conditions. Professional trading rules emphasize cutting losses quickly while allowing profitable positions to run, a fundamental principle that separates winners from losers in the markets.
Patience and Market Timing Over Frequent Trading
Focus on Market Leaders During Strong Trend Movements
Continuous Learning and Mistake Analysis for Improvement
Distinguished traders maintain detailed trading journals to analyze both successful and failed trades, using these insights to refine their strategies continuously. This commitment to learning from mistakes while adapting to changing market conditions represents a cornerstone of professional trader development programs and long-term trading success.
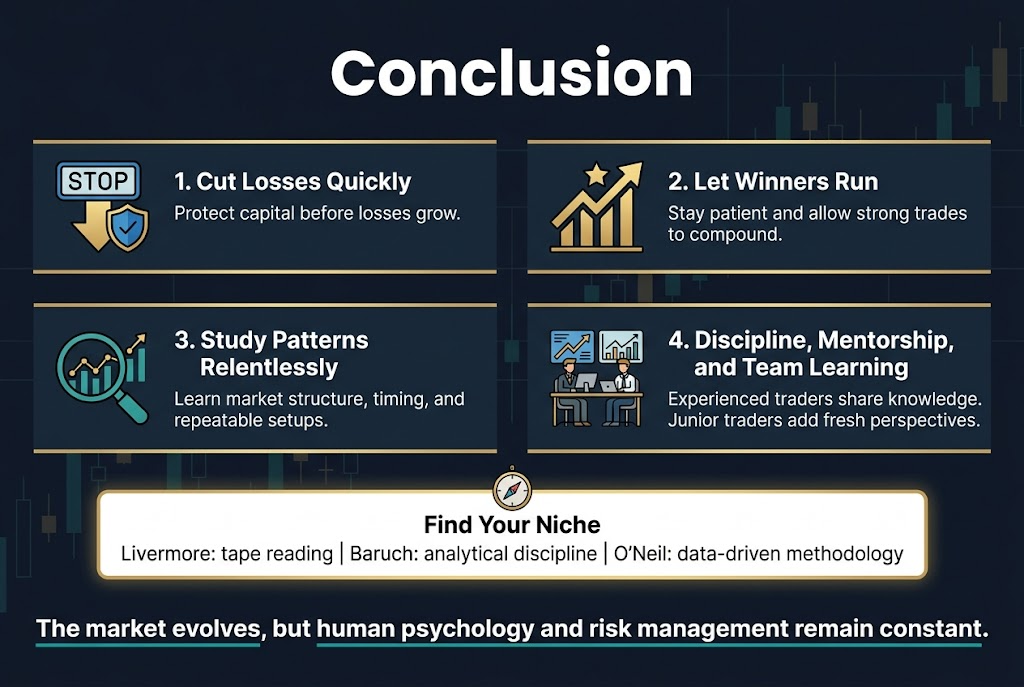
The trading legends profiled here—from Jesse Livermore’s mastery of market timing to William O’Neil’s systematic approach—demonstrate that successful trading transcends any single era or market condition. Their enduring principles reveal common threads: cutting losses quickly, letting winners run, studying market patterns relentlessly, and maintaining unwavering discipline even when emotions run high. These traders understood that the market rewards patience, preparation, and the ability to learn from both victories and defeats.
The path to trading excellence requires more than just studying these historical examples—it demands structured development, mentorship, and continuous refinement of one’s approach. As today’s successful trading organizations have discovered, the most effective learning occurs within teams where experienced traders share knowledge and junior traders contribute fresh perspectives. Whether you’re drawn to Livermore’s tape reading, Baruch’s analytical discipline, or O’Neil’s data-driven methodology, the key is finding your niche while adhering to the timeless principles that separate consistent winners from the majority who struggle. The market may evolve, but human psychology and the fundamental rules of risk management remain constant—making these lessons as relevant today as they were decades ago.