Table of Contents
Introduction
How I Learned to Read Gold Charts Like Smart Money
When I first started trading Gold (XAU/USD), I relied heavily on indicators such as RSI, MACD, and moving averages. While these tools were useful, I often felt I was reacting to the market rather than understanding what was actually driving price.
Everything changed when I began studying Smart Money Concepts (SMC) and ICT trading methodology.
By focusing on market structure, liquidity, order blocks, and Fair Value Gaps, I started seeing the chart from the perspective of institutional traders. Instead of chasing candles, I learned to wait for price to sweep liquidity, confirm a structural shift, and return to high-probability entry zones.
This article shares the same framework I personally use to analyze Gold charts.
Important Note: This guide is for educational purposes only and reflects my personal trading approach. It does not constitute financial advice.
Reading Gold Charts Like Smart Money
Reading Gold Charts Like Smart Money is one of the most valuable skills a trader can develop. After years of studying Gold (XAU/USD) and moving away from lagging indicators, I discovered that institutional traders leave clear footprints on the chart through market structure, liquidity sweeps, Break of Structure (BOS), Change of Character (CHOCH), Fair Value Gaps (FVGs), and Order Blocks.
In this 12-step guide, I share the same framework I personally use to analyze Gold charts and identify high-probability trading opportunities using Smart Money Concepts (SMC) and ICT methodology.
Why Gold Is Ideal for Smart Money Trading
Gold is one of the best instruments for applying Smart Money Concepts because:
- It has deep institutional liquidity.
- It reacts strongly to macroeconomic events.
- Price frequently sweeps liquidity before trending.
- London and New York sessions produce clean setups.
Gold often experiences significant movement during:
- Non-Farm Payrolls (NFP)
- Consumer Price Index (CPI)
- Federal Reserve meetings
- Geopolitical events
For macroeconomic context, I regularly monitor economic calendars such as Forex Factory and official releases from the U.S. Bureau of Labor Statistics.
Market Structure Basics
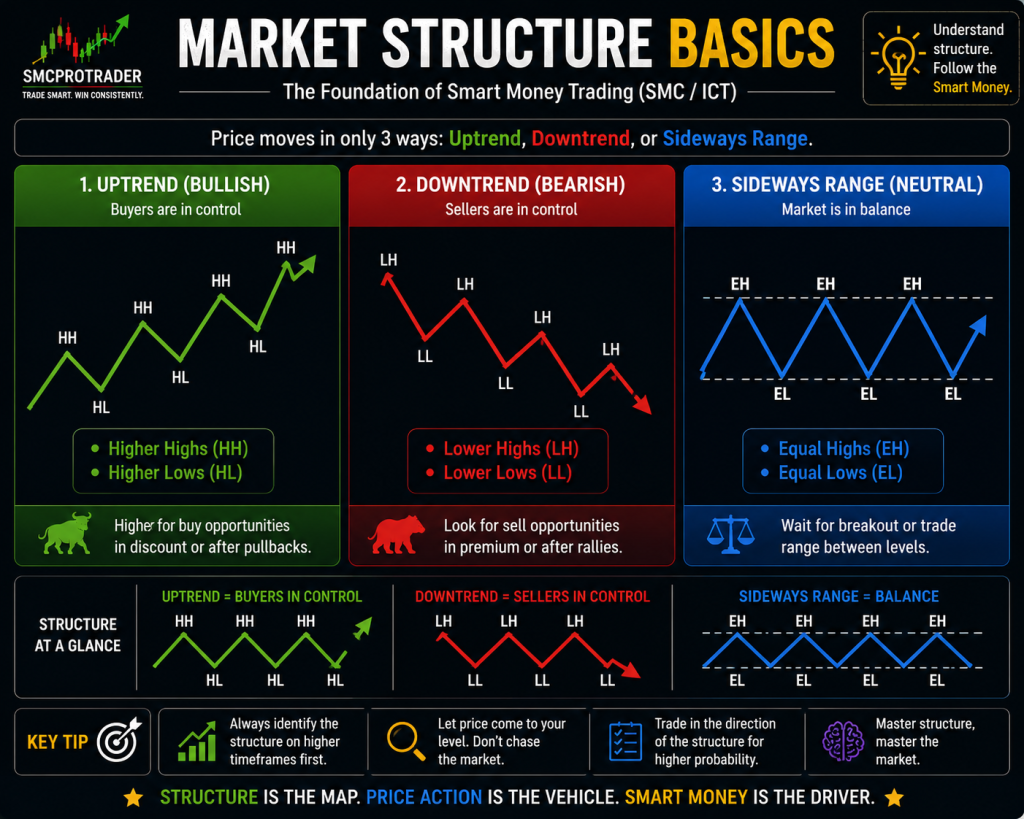
Market structure tells us whether buyers or sellers are in control.
Price moves in only three ways:
- Uptrend
- Downtrend
- Sideways Range
Uptrend (Bullish)
- Higher Highs (HH)
- Higher Lows (HL)
Downtrend (Bearish)
- Lower Highs (LH)
- Lower Lows (LL)
Range (Neutral)
- Equal Highs (EH)
- Equal Lows (EL)
Before looking for any trade setup, I always identify the current market structure.
Break of Structure (BOS)
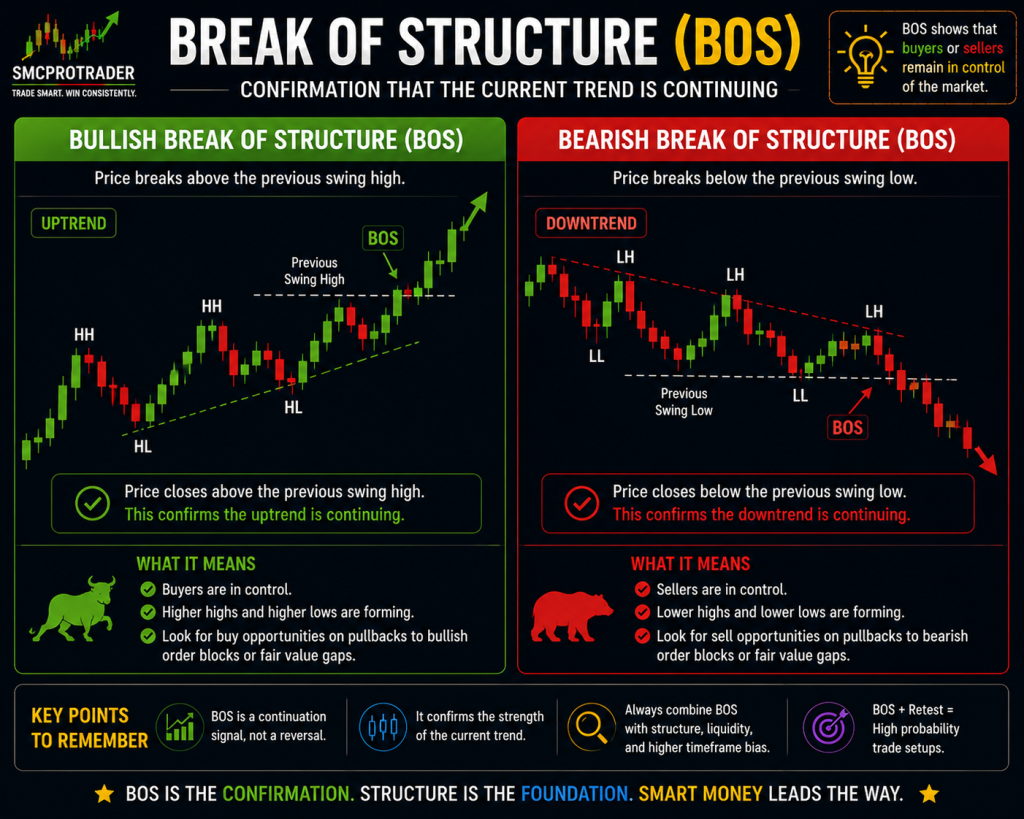
BOS confirms trend continuation.
Bullish BOS
Price closes above the previous swing high.
Bearish BOS
Price closes below the previous swing low.
BOS indicates that the prevailing trend remains intact.
Change of Character (CHOCH)
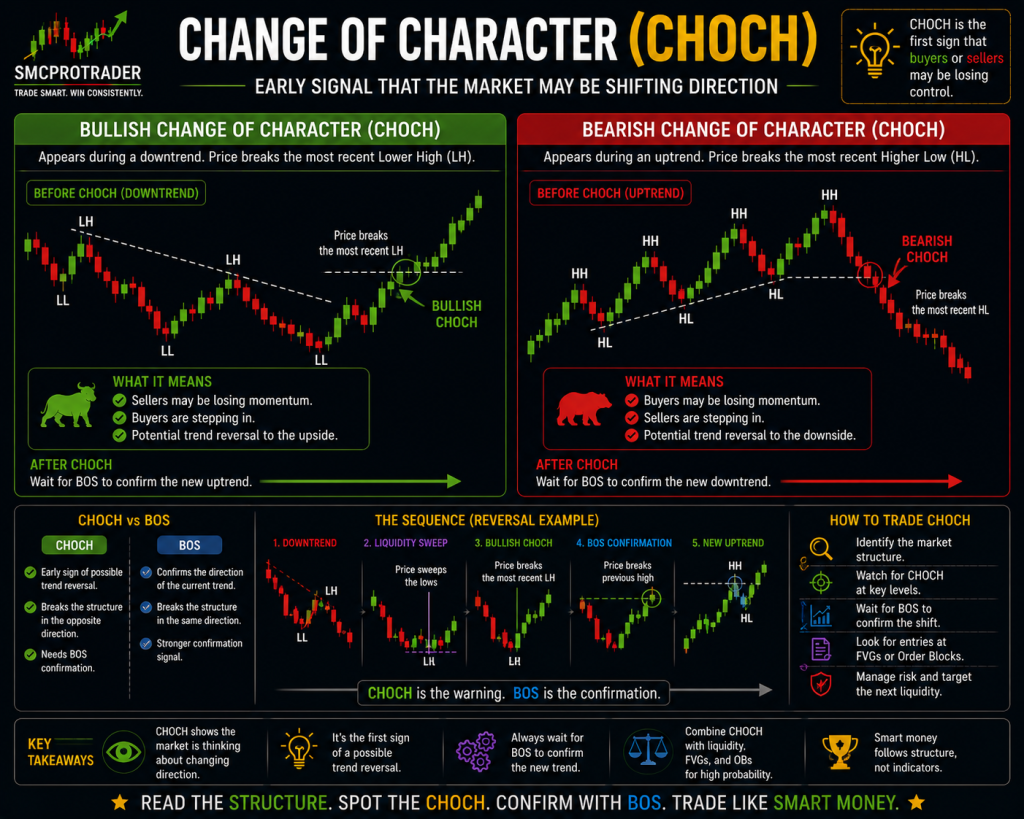
CHOCH is an early sign of a potential reversal.
Bullish CHOCH
After a downtrend, price breaks the most recent Lower High.
Bearish CHOCH
After an uptrend, price breaks the most recent Higher Low.
CHOCH alerts traders that market control may be shifting.
Reading Gold Charts Like Smart Money requires understanding how institutions create liquidity, manipulate price, and move the market toward premium and discount zones. By learning to combine market structure, BOS, CHOCH, Fair Value Gaps, and Order Blocks, traders can build a structured approach to analyzing Gold with confidence.
Fair Value Gaps (FVGs)
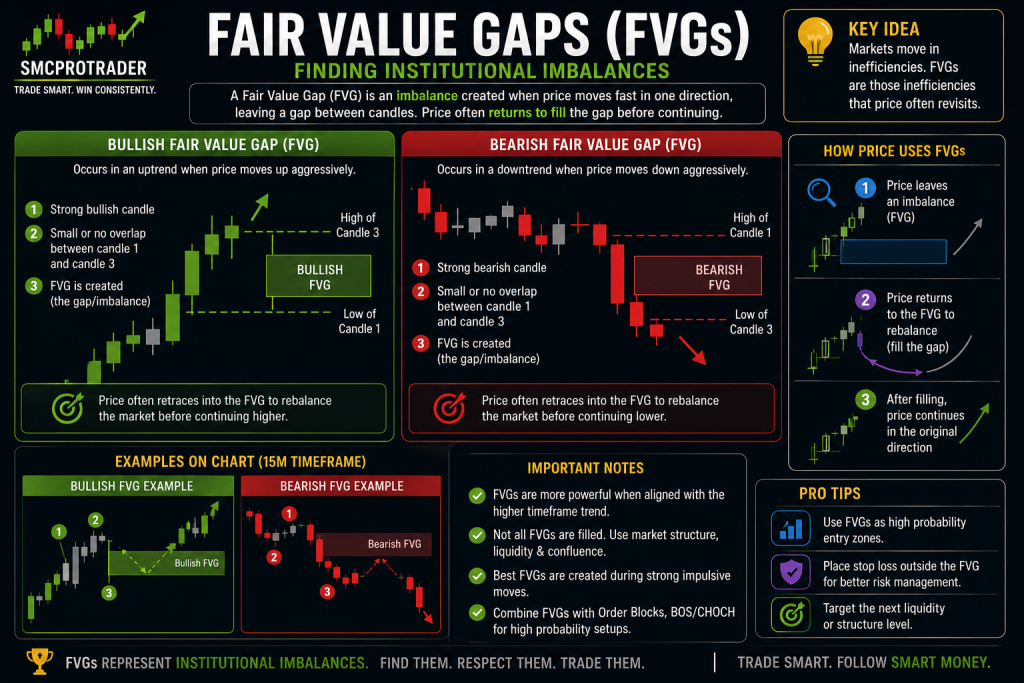
A Fair Value Gap is an imbalance created when price moves aggressively.
Why FVGs Matter
Markets often retrace to these imbalances before continuing.
Bullish FVG
Created during strong upward movement.
Bearish FVG
Created during strong downward movement.
In my trading, FVGs are among the most reliable retracement zones.
Order Blocks (OBs)
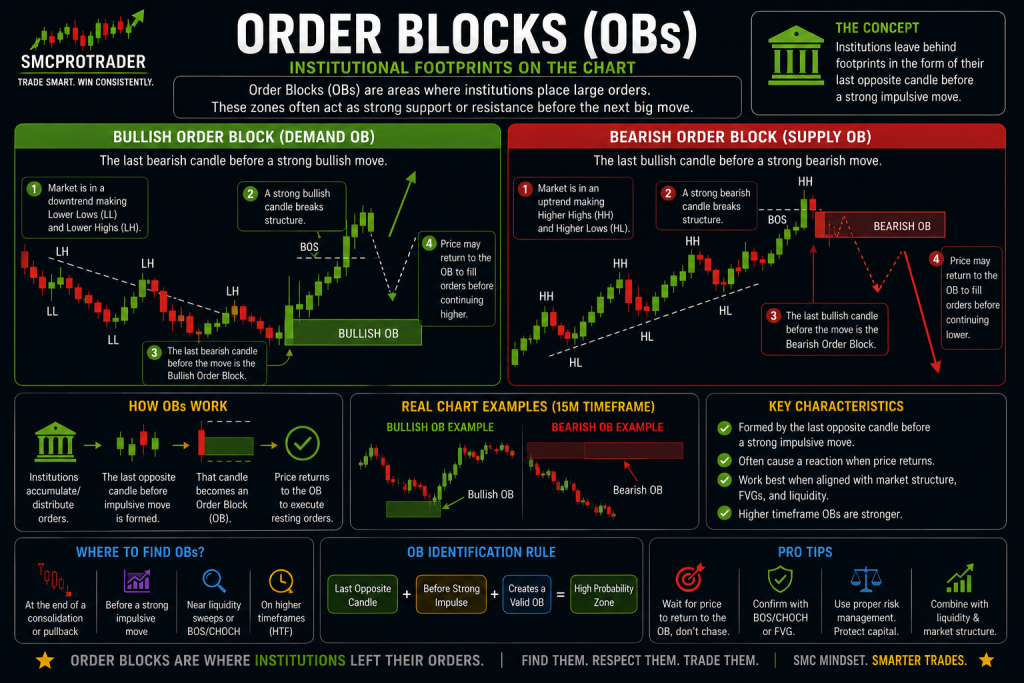
Order Blocks are areas where institutions likely placed significant orders.
Bullish Order Block
The last bearish candle before a strong rally.
Bearish Order Block
The last bullish candle before a sharp decline.
These zones often act as support or resistance.
Liquidity and Stop Hunts
Liquidity refers to clusters of stop-loss orders.
Buy-Side Liquidity
Above highs or equal highs.
Sell-Side Liquidity
Below lows or equal lows.
Institutions often target these areas before reversing.
Previous Day High (PDH) and Previous Day Low (PDL)
PDH and PDL are among the most important liquidity levels on Gold.
Previous Day High (PDH)
Yesterday’s highest price.
Previous Day Low (PDL)
Yesterday’s lowest price.
These levels frequently act as magnets for price.
Strong vs Weak Highs and Lows
Weak High
Likely to be broken.
Strong High
Produced after strong bearish displacement.
Weak Low
Likely to be broken.
Strong Low
Produced after strong bullish displacement.
Equilibrium, Premium, and Discount
Equilibrium is the midpoint of a trading range.
Equilibrium = {High + Low}/{2}
Premium Zone
Above equilibrium. Price is relatively expensive.
Discount Zone
Below equilibrium. Price is relatively cheap.
Core Principle
- Buy in Discount.
- Sell in Premium.
Institutional Trading Sequence
The framework I follow:
- Mark key levels (PDH, PDL, session highs/lows)
- Determine market structure
- Identify liquidity pools
- Wait for liquidity sweep
- Confirm CHOCH or BOS
- Find FVG or Order Block
- Enter on retracement
- Target next liquidity
Liquidity → CHOCH → BOS → FVG/OB → Entry → Target Liquidity
Step-by-Step Gold Chart Analysis Process
1. Determine Higher Timeframe Bias
Use the 4H and 1H charts.
2. Mark Key Levels
- PDH
- PDL
- Asian High/Low
- Strong and Weak Highs/Lows
3. Wait for Liquidity Sweep
Watch for stop hunts above highs or below lows.
4. Confirm Structural Shift
Look for CHOCH and BOS.
5. Locate Entry Zone
Identify FVGs and Order Blocks.
6. Execute Trade
Use defined risk.
7. Target Liquidity
Aim for the next significant liquidity pool.
Reading Gold Charts Like Smart Money becomes much easier once you understand market structure, liquidity, BOS, CHOCH, Fair Value Gaps, and Order Blocks. With practice and discipline, this institutional framework can help you analyze XAU/USD with greater clarity and confidence.
Real Gold Trade Example (Bullish Setup)
On a recent Gold trade:
- Price swept the Previous Day Low.
- A bullish CHOCH formed on the 15-minute chart.
- Price created a bullish BOS.
- A Fair Value Gap appeared.
- Price retraced into the FVG.
- I entered long.
- Stop loss was placed below the sweep low.
- Target was the Previous Day High.
This setup aligned with the higher timeframe bullish bias and delivered a favorable risk-to-reward ratio.
Also Read: Best Crypto Exchanges for Beginners in 2026: Safe and Easy Platforms
How to Tell aBest Crypto Exchanges for Beginners in 2026: Safe and Easy Platforms Liquidity Sweep from a Genuine Breakout
This is one of the most common questions traders ask.
Liquidity Sweep Characteristics
- Sharp wick through key level.
- Quick rejection.
- CHOCH forms in the opposite direction.
Genuine Breakout Characteristics
- Strong candle body closes beyond the level.
- Retest holds.
- Trend continues.
The confirmation of CHOCH is what helps me distinguish between the two.
Common Trading Mistakes
Entering Without Confirmation
Wait for structure.
Ignoring Higher Timeframe Bias
Trade with the broader trend.
Chasing Price
Let price retrace into your zone.
Over-Risking
Risk a small percentage per trade.
Trading During Major News Without a Plan
Volatility can invalidate technical setups.
Frequently Asked Questions
Is Smart Money Concepts trading 100% accurate?
No. No trading strategy is perfect. SMC aims to improve probabilities and reward-to-risk, not guarantee profits.
What timeframe is best for Gold?
4H and 1H for bias; 15M and 5M for entries.
Do Fair Value Gaps always fill?
No, but many are revisited.
Can this strategy work on Forex and Crypto?
Yes, especially in liquid markets.
When it comes to Reading Gold Charts Like Smart Money, the goal is not to predict every move but to recognize the footprints of institutional activity. This approach helps traders focus on high-probability setups rather than emotional decisions.
Why This Method Works
Smart Money Concepts work because they align your analysis with how large market participants operate.
Instead of focusing on lagging indicators, you analyze:
- Where liquidity is resting
- Who controls the structure
- Where institutional orders may be located
- Which price zones offer favorable risk-to-reward
This approach helps you think like a professional trader.
Risk Disclaimer
Trading Gold, Forex, Stocks, and Cryptocurrency involves substantial risk. Losses can exceed deposits if leverage is used. This content is for educational purposes only and does not constitute investment advice. Always conduct your own research and consult a qualified financial advisor if necessary.
Final Thoughts
Learning to read Gold charts like smart money transformed the way I trade.
When you understand:
- Market Structure
- BOS and CHOCH
- Liquidity
- Fair Value Gaps
- Order Blocks
- Premium and Discount
you begin to see the market as a sequence of logical institutional actions rather than random candles.
Buy in Discount after a liquidity sweep and bullish CHOCH. Sell in Premium after a liquidity sweep and bearish CHOCH.
Master the structure, and the market becomes much easier to understand.
For more info: Tradingview
About the Author
Shiva Naresh is the founder of SMCProTrader and creator of zyqorr.com, where he shares educational content on Smart Money Concepts, trading psychology, and systematic market analysis.
With hands-on experience trading Gold, Forex, and other financial markets, Shiva focuses on simplifying institutional trading concepts for retail traders.
Website: zyqorr.com
Mission: Helping traders understand Smart Money Concepts and trade with confidence.
